> ## Documentation Index
> Fetch the complete documentation index at: https://cockroachlabs.mintlify.site/llms.txt
> Use this file to discover all available pages before exploring further.
# Insights Page
export const InternalLink = ({version, path = "", children, ...props}) => {
let detectedVersion = version || "stable";
if (typeof window !== 'undefined' && !version) {
const match = window.location.pathname.match(/\/docs\/([^/]+)/);
if (match) {
detectedVersion = match[1];
}
}
const normalizedPath = path.startsWith("/") ? path.slice(1) : path;
return
{children}
;
};
On a secure cluster, you must be an `admin` user or a SQL user with the `VIEWACTIVITY` or `VIEWACTIVITYREDACTED` system privilege (or the legacy `VIEWACTIVITY` role option) to access this area of the DB Console. Refer to DB Console security.
The **Insights** page exposes problems that CockroachDB has detected in your workloads and schemas. The page also offers recommendations to improve the performance of your workloads. These are called *insights* in the DB Console.
The **Insights** page helps you:
* Identify SQL statements with high retry counts, slow execution, or suboptimal plans.
* Identify indexes that should be created, altered, replaced, or dropped to improve performance.
## Workload Insights tab
The **Workload Insights** tab displays insights related to transaction and statement executions.
### Transaction Executions view
To display this view, click **Insights** in the left-hand navigation of the DB Console and select **Workload Insights > Transaction Executions**. The **Transaction Executions** view provides an overview of all transaction executions that have been flagged with insights.
The rows in this page are populated from the `crdb_internal.transaction_contention_events` and `crdb_internal.cluster_txn_execution_insights` tables.
* The results displayed in the **Transaction Executions** view will be available as long as a corresponding row in the `crdb_internal.transaction_contention_events` or `crdb_internal.cluster_txn_execution_insights` tables exists. The rows in `crdb_internal.transaction_contention_events` on each node must use less space than `sql.contention.event_store.capacity`, and the rows in `crdb_internal.transaction_contention_events` cannot exceed `sql.insights.execution_insights_capacity`.
* The default tracing behavior captures a small percent of transactions so not all contention events will be recorded. When investigating transaction contention, you can set the `sql.trace.txn.enable_threshold` cluster setting to always capture contention events.
The transaction insights table has the following columns:
| Column | Description |
| ------------------------------- | ------------------------------------------------------------------------------------------------------------------------------------------------------------------------------------------------------------------------------------------------------------------------------------------------------------------------------------------------------------------------------- |
| Latest Transaction Execution ID | The execution ID of the latest execution with the transaction fingerprint. To view [details of the execution](#transaction-execution-details), click the execution ID. |
| Transaction Fingerprint ID | The transaction fingerprint ID of the latest transaction execution. |
| Transaction Execution | The transaction fingerprint of the latest transaction execution. |
| Status | The status of the transaction: `Failed` or `Completed`. |
| Insights | The [insight type](#workload-insight-types) for the transaction execution. |
| Start Time (UTC) | The timestamp when the transaction execution started. |
| Contention Time | The amount of time the transaction execution spent waiting in contention. |
| CPU Time | The amount of CPU time spent executing the transaction. The CPU time represents the time spent and work done within SQL execution operators. The CPU time includes time spent in the SQL layer. It does not include time spent in the storage layer. |
| Application Name | The name specified by the `application\_name` session setting. |
### Transaction Execution details
The transaction execution details view provides more information on a transaction execution insight.
#### Default details
This information is displayed for all insight types.
| Field/Column | Description |
| -------------------------- | ------------------------------------------------------------------------------------------------------------------------------------------------------------------------------------------------------------------------------------------------------------------------------------------------------------------------------------------------------------------------------ |
| Start Time | The timestamp when the transaction execution started. |
| End Time | The timestamp when the transaction execution ended. |
| Elapsed Time | The time that elapsed during transaction execution. |
| CPU Time | The amount of CPU time spent executing the transaction. The CPU time represents the time spent and work done within SQL execution operators. The CPU time includes time spent in the SQL layer. It does not include time spent in the storage layer. |
| Rows Read | The total number of rows read by the transaction execution. |
| Rows Written | The total number of rows written by the transaction execution. |
| Priority | The priority of the transaction execution. |
| Number of Retries | The total number of retries of the transaction. |
| Session ID | The ID of the session the transaction was executed from. |
| Application | The name specified by the `application\_name` session setting. |
| Transaction Fingerprint ID | The fingerprint ID of the transaction execution. To view details of the transaction, click the fingerprint ID. |
| Insights | The [insight type](#workload-insight-types). |
| Details | Provides details on the insight. For example, if the insight type is High Contention, **Time Spent Waiting** and **Description** are displayed. If the insight type is Failed Execution, **Error Code** and **Error Message** are displayed. |
#### Conditional details
Additional information is displayed for the following insight types:
1. [**High Contention**](#high-contention): All transaction executions flagged with this insight type will display a **Transaction with ID \{transaction ID} waited on** section which provides details of the blocking transaction execution.
2. [**Failed Execution**](#failed-execution): Certain transaction executions flagged with this insight type will display a **Failed Execution** section with **Conflicting Transaction** and **Conflicting Location** information. The following 3 conditions are required:
* The `sql.contention.record_serialization_conflicts.enabled` cluster setting is set to `true`. By default, this is set to `false`.
* **Error Code** is `40001`, a `serialization_failure`.
* **Error Message** includes `RETRY_SERIALIZABLE` `- failed preemptive refresh due to conflicting locks`.
| Field/Column | Insight Type(s) | Description |
| -------------------------------- | --------------------------------- | -------------------------------------------------------------------------------------------------------------------------------------------------------------------------------------------------------------------------------------------------------------------------------------- |
| Transaction Execution \[ID] | High Contention, Failed Execution | The execution ID of the blocking or conflicting transaction execution. |
| Transaction Fingerprint \[ID] | High Contention, Failed Execution | The transaction fingerprint ID of the blocking or conflicting transaction execution. For a Failed Execution, view details of the transaction fingerprint by clicking the transaction fingerprint ID. |
| Statement Waiting Execution ID | High Contention | The execution ID of the waiting statement. |
| Statement Waiting Fingerprint ID | High Contention | The statement fingerprint ID of the waiting statement. |
| Transaction Execution | High Contention | The queries attempted in the transaction. |
| Contention Start Time (UTC) | High Contention | The timestamp at which contention was detected for the transaction. |
| Contention Time | High Contention | The time that transactions with this execution ID were in contention with other transactions within the specified time interval. |
| Schema Name | High Contention | The name of the contended schema. |
| Database \[Name] | High Contention, Failed Execution | The name of the contended or conflicting database. |
| Table \[Name] | High Contention, Failed Execution | The name of the contended or conflicting table. |
| Index \[Name] | High Contention, Failed Execution | The name of the contended or conflicting index. |
### Statement Executions view
The **Statement Executions** view provides an overview of all statement executions that have been flagged with insights.
To display this view, click **Insights** in the left-hand navigation of the DB Console and select **Workload Insights > Statement Executions**.
The rows in this page are populated from the `crdb_internal.cluster_execution_insights` table.
* The results displayed on the **Statement Executions** view will be available as long as the number of rows in each node is less than the `sql.insights.execution_insights_capacity` cluster setting.
* The default tracing behavior captures a small percent of transactions, so not all contention events will be recorded. When investigating transaction contention, you can set the `sql.trace.txn.enable_threshold` cluster setting to always capture contention events.
Click **Columns** to select the columns to display in the table.
The statement insights table has the following columns available:
| Column | Description |
| ------------------------------- | ----------------------------------------------------------------------------------------------------------------------------------------------------------------------------------------------------------------------------------------------------------------------------------------------------------------------------------------------------------------------------- |
| Latest Statement Execution ID | The execution ID of the latest execution with the statement fingerprint. To view [details of the execution](#statement-execution-details), click the execution ID. |
| Statement Fingerprint ID | The statement fingerprint ID of the latest statement execution. |
| Statement Execution | The statement fingerprint of the latest statement execution. |
| Status | The status of the transaction: `Failed` or `Completed`. |
| Insights | The [insight type](#workload-insight-types) for the statement execution. |
| Start Time (UTC) | The timestamp when the statement execution started. |
| Elapsed Time | The time that elapsed to complete the statement execution. |
| User Name | The name of the user that invoked the statement execution. |
| Application Name | The name specified by the `application\_name` session setting. |
| Rows Processed | The total number of rows read and written. |
| Retries | The number of times the statement execution was retried. |
| Contention Time | The amount of time the statement execution spent waiting in contention. |
| CPU Time | The amount of CPU time spent executing the statement. The CPU time represents the time spent and work done within SQL execution operators. The CPU time includes time spent in the SQL layer. It does not include time spent in the storage layer. |
| Full Scan | Whether the execution performed a full scan of the table. |
| Transaction Fingerprint ID | The ID of the transaction fingerprint for the statement execution. |
| Latest Transaction Execution ID | The ID of the transaction execution for the statement execution. |
### Statement Execution details
The statement execution details view provides more information on a statement execution insight.
#### Default details
This information is displayed for all insight types.
| Field/Column | Description |
| -------------------------- | ---------------------------------------------------------------------------------------------------------------------------------------------------------------------------------------------------------------------------------------------------------------------------------------------------------------------------------------------------------------------------- |
| Start Time | The timestamp when the statement execution started. |
| End Time | The timestamp when the statement execution ended. |
| Elapsed Time | The time that elapsed during statement execution. |
| CPU Time | The amount of CPU time spent executing the statement. The CPU time represents the time spent and work done within SQL execution operators. The CPU time includes time spent in the SQL layer. It does not include time spent in the storage layer. |
| Rows Read | The total number of rows read by the statement execution. |
| Rows Written | The total number of rows written by the statement execution. |
| Transaction Priority | The priority of the transaction for the statement execution. |
| Full Scan | Whether the execution performed a full scan of the table. |
| Transaction Retries | The total number of retries of the transaction for the statement execution. |
| Session ID | The ID of the session the statement was executed from. |
| Transaction Fingerprint ID | The ID of the transaction fingerprint for the statement execution. |
| Transaction Execution ID | The ID of the transaction execution for the statement execution. |
| Statement Fingerprint ID | The fingerprint ID of the statement fingerprint for the statement execution. |
| Insights | The [insight type](#workload-insight-types). |
| Details | Provides details on the insight. For example, if the insight type is High Contention, **Time Spent Waiting** and **Description** are displayed. If the insight type is Failed Execution, **Error Code** and **Error Message** are displayed. |
#### Conditional details
This information is displayed for only the [**High Contention**](#high-contention) insight type. All statement executions flagged with this insight type will display a **Statement with ID \{statement ID} waited on** section which provides details of the blocking transaction execution.
| Column | Description |
| -------------------------- | -------------------------------------------------------------------------------------------------------------------------------------------------------------------------------------------------------- |
| Transaction Execution ID | The execution ID of the blocking transaction execution. |
| Transaction Fingerprint ID | The transaction fingerprint ID of the blocking transaction execution. |
| Contention Time | The time that transactions with this execution ID were in contention with other transactions within the specified time interval. |
| Database Name | The name of the contended database. |
| Schema Name | The name of the contended schema. |
| Table Name | The name of the contended table. |
| Index Name | The name of the contended index. |
## Workload Insight types
The Workload Insights tab surfaces the following type of insights:
* [Failed Execution](#failed-execution)
* [High Contention](#high-contention)
* [High Retry Count](#high-retry-count)
* [Slow Execution](#slow-execution)
* [Suboptimal Plan](#suboptimal-plan)
### Failed Execution
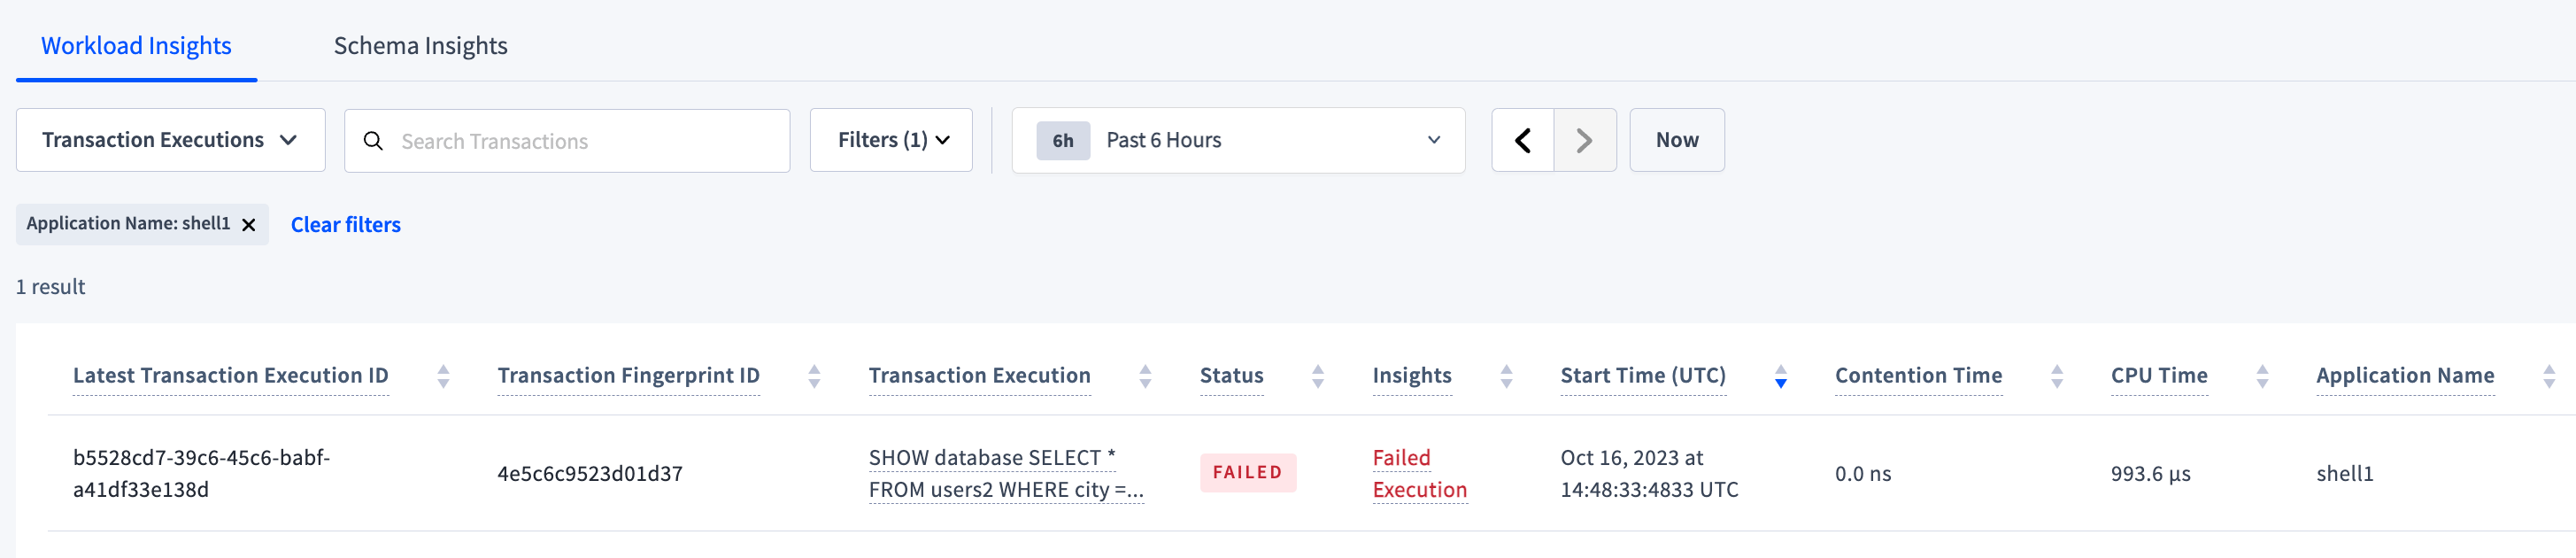
The transaction or statement execution failed. The following screenshot shows a failed transaction execution:
 The following screenshot shows the default details of the preceding failed transaction execution.
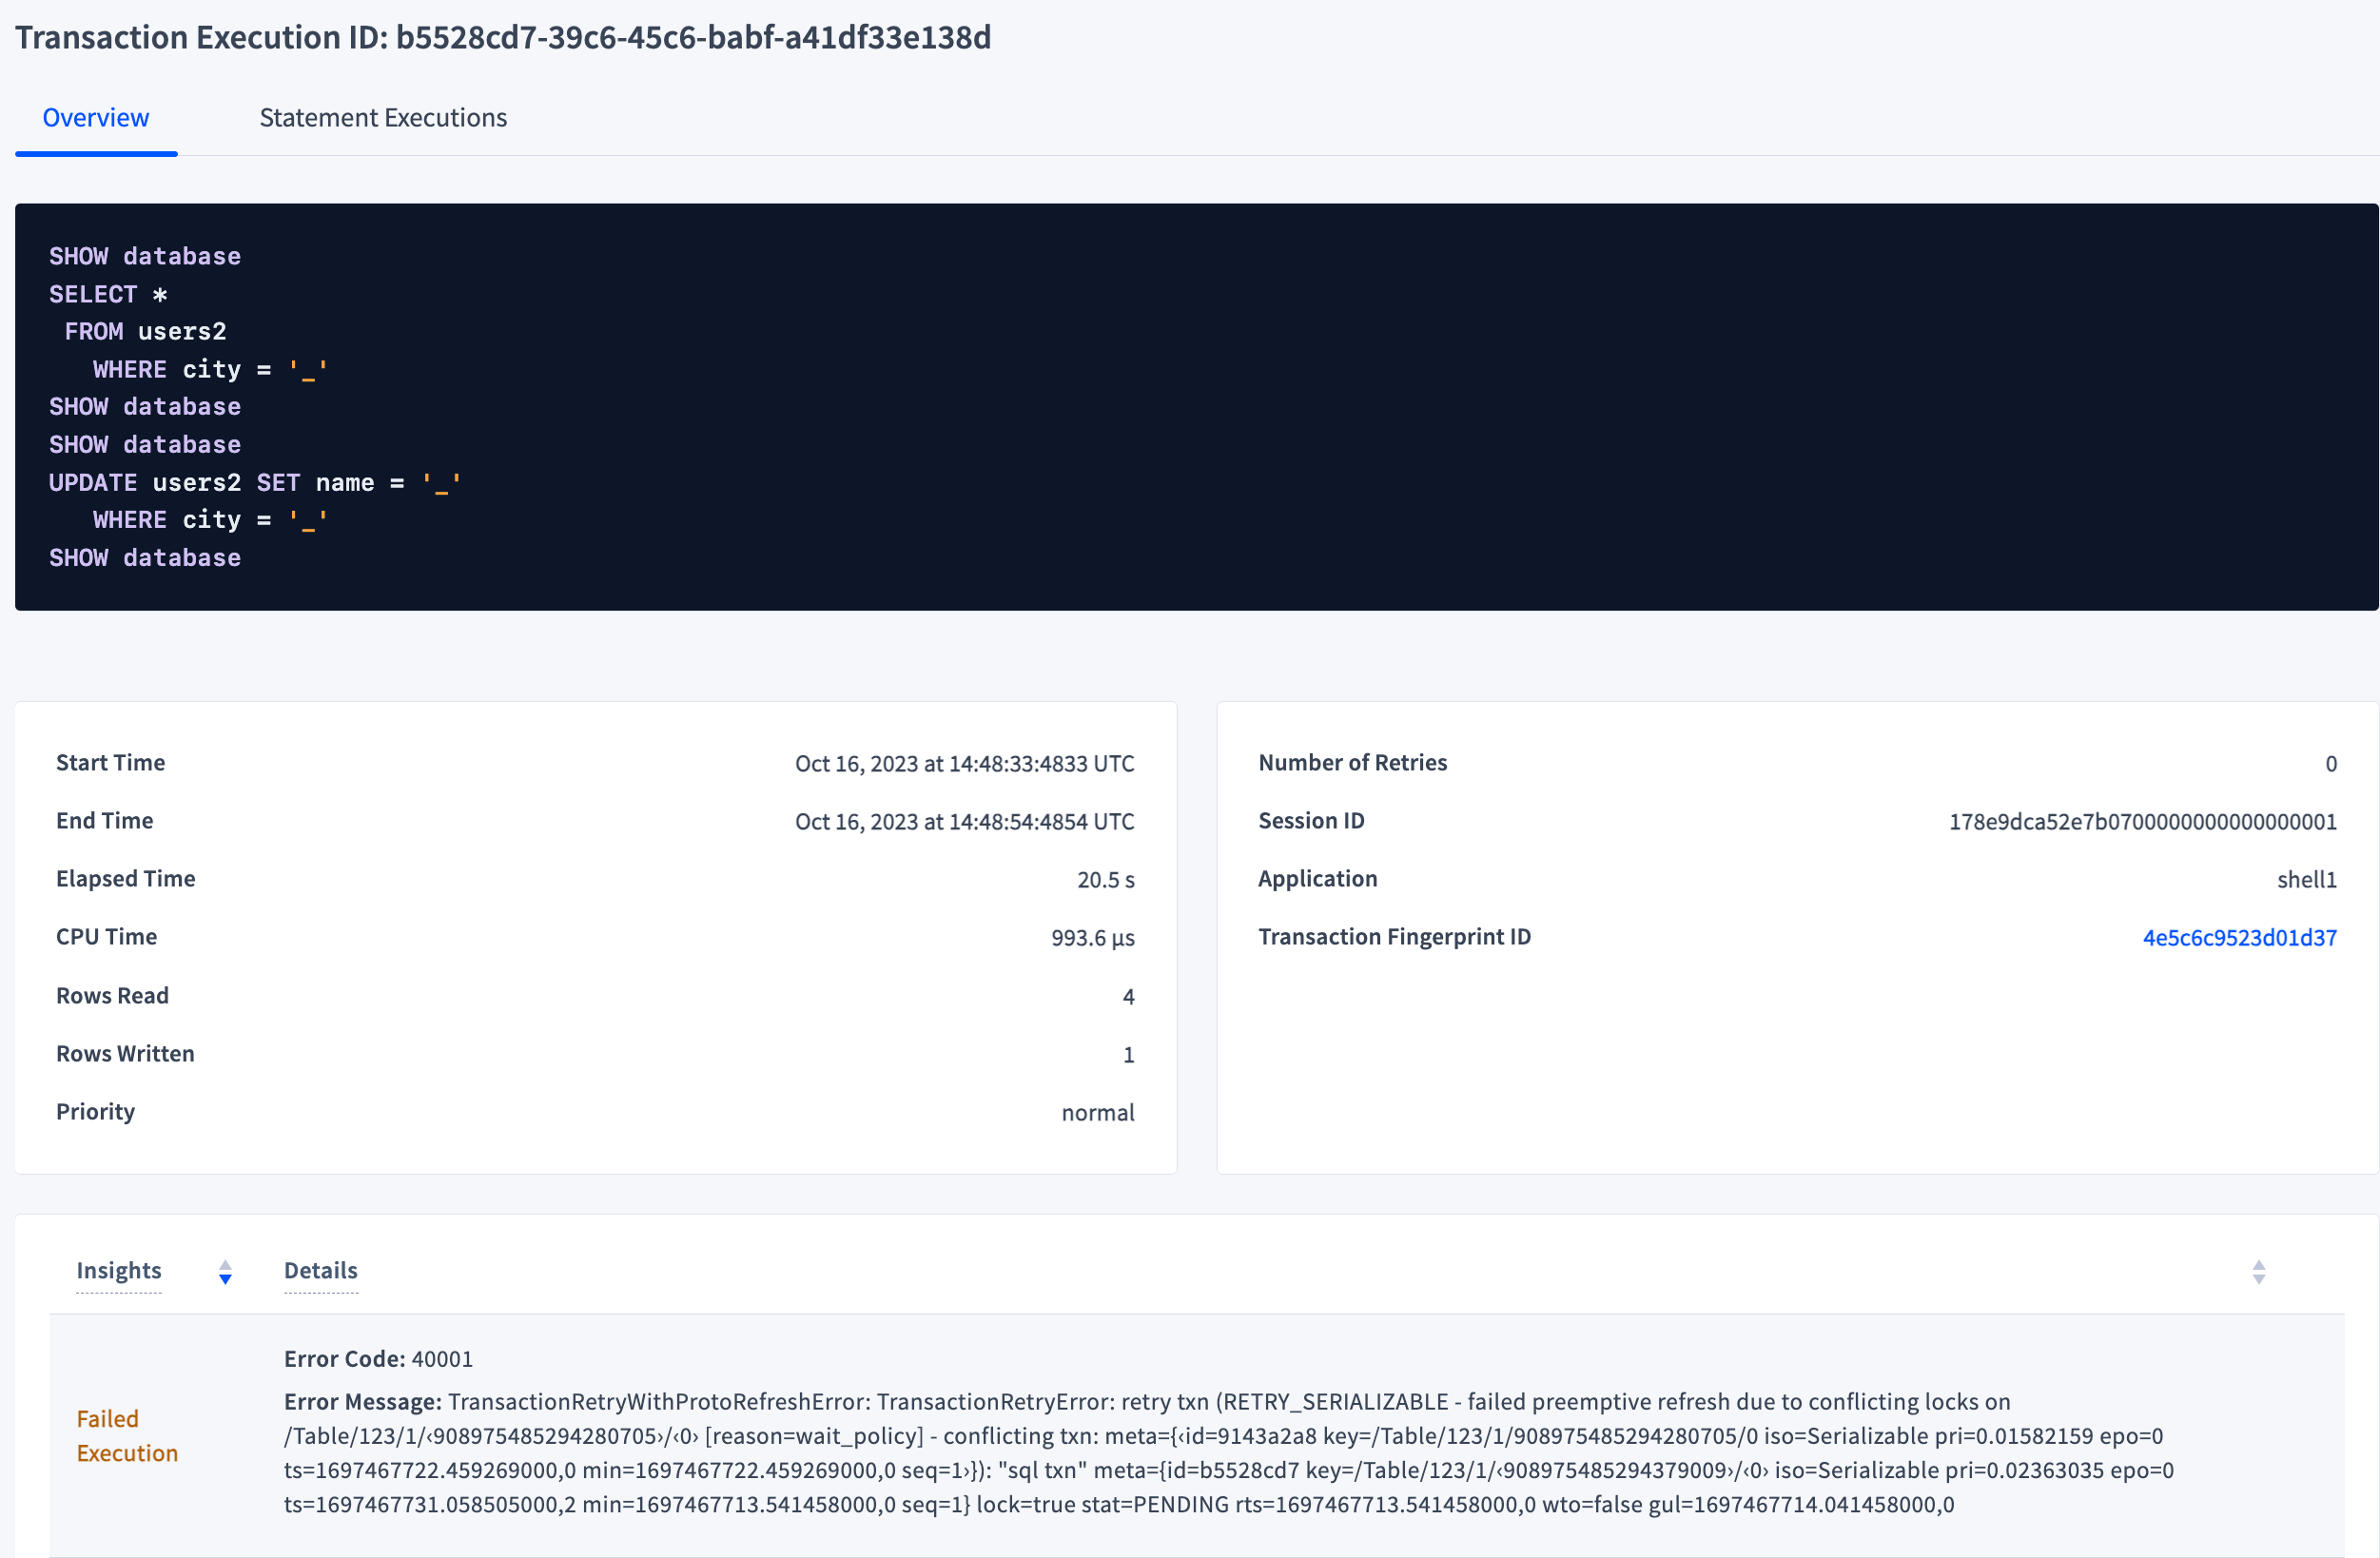 The **Insights** column shows the name of the insight, in this case **Failed Execution**. The **Details** column provides the **Error Code** and **Error Message**. CockroachDB uses [PostgreSQL Error Codes](https://www.postgresql.org/docs/current/errcodes-appendix). In this example, Error Code `40001` is a `serialization_failure`.
#### Serialization conflict due to transaction contention
The following screenshot shows the conditional details of the preceding failed transaction execution. In this case, there was a *serialization conflict*, also known as an *isolation conflict*, due to transaction contention. (For transaction contention that causes *lock contention*, see [High Contention](#high-contention)).
The **Insights** column shows the name of the insight, in this case **Failed Execution**. The **Details** column provides the **Error Code** and **Error Message**. CockroachDB uses [PostgreSQL Error Codes](https://www.postgresql.org/docs/current/errcodes-appendix). In this example, Error Code `40001` is a `serialization_failure`.
#### Serialization conflict due to transaction contention
The following screenshot shows the conditional details of the preceding failed transaction execution. In this case, there was a *serialization conflict*, also known as an *isolation conflict*, due to transaction contention. (For transaction contention that causes *lock contention*, see [High Contention](#high-contention)).
 To capture more information in the event of a failed transaction execution due to a serialization conflict, set the `sql.contention.record_serialization_conflicts.enabled` cluster setting to `true` (default is `false`). With this setting enabled, when the **Error Code** is `40001` and the **Error Message** specifically has `RETRY_SERIALIZABLE - failed preemptive refresh``due to conflicting locks`, a conditional **Failed Execution** section is displayed with **Conflicting Transaction** and **Conflicting Location** information.
To troubleshoot, refer to the performance tuning recipe for transaction retry errors.
### High Contention
The transaction or statement execution experienced high contention time according to the threshold set in the `sql.insights.latency_threshold` cluster setting. This type of contention is also known as *lock contention*. (For transaction contention that causes *serialization conflict*, see [serialization conflict due to transaction contention](#serialization-conflict-due-to-transaction-contention).)
To troubleshoot, refer to the performance tuning recipe for identifying and unblocking a waiting transaction.
The following screenshot shows the execution of a transaction flagged with **High Contention**:
To capture more information in the event of a failed transaction execution due to a serialization conflict, set the `sql.contention.record_serialization_conflicts.enabled` cluster setting to `true` (default is `false`). With this setting enabled, when the **Error Code** is `40001` and the **Error Message** specifically has `RETRY_SERIALIZABLE - failed preemptive refresh``due to conflicting locks`, a conditional **Failed Execution** section is displayed with **Conflicting Transaction** and **Conflicting Location** information.
To troubleshoot, refer to the performance tuning recipe for transaction retry errors.
### High Contention
The transaction or statement execution experienced high contention time according to the threshold set in the `sql.insights.latency_threshold` cluster setting. This type of contention is also known as *lock contention*. (For transaction contention that causes *serialization conflict*, see [serialization conflict due to transaction contention](#serialization-conflict-due-to-transaction-contention).)
To troubleshoot, refer to the performance tuning recipe for identifying and unblocking a waiting transaction.
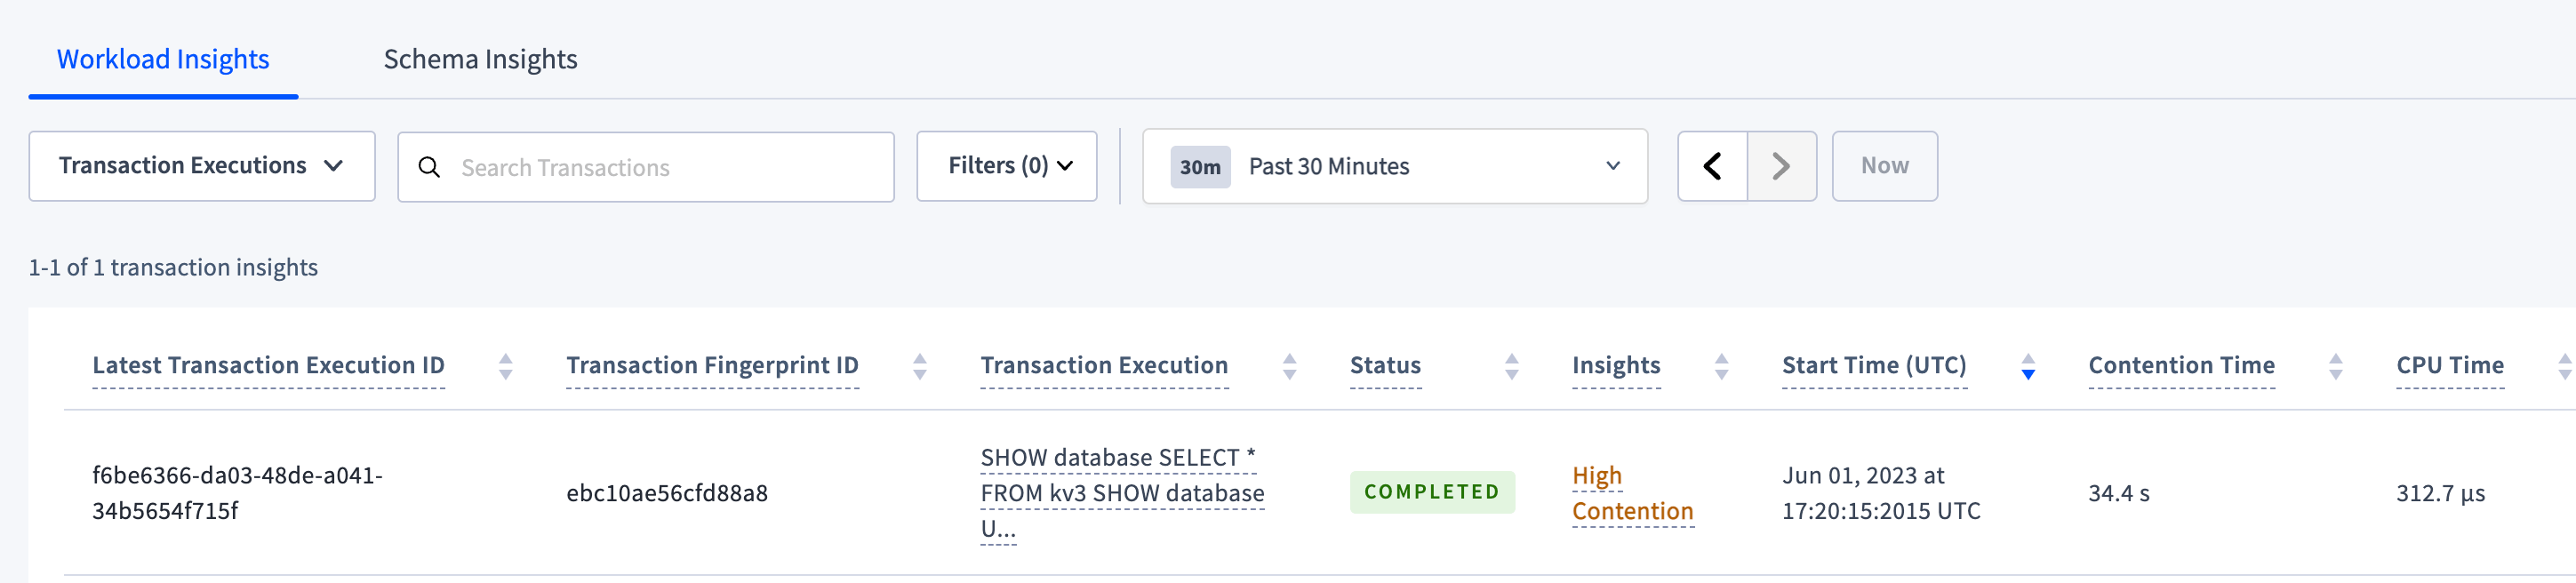
The following screenshot shows the execution of a transaction flagged with **High Contention**:
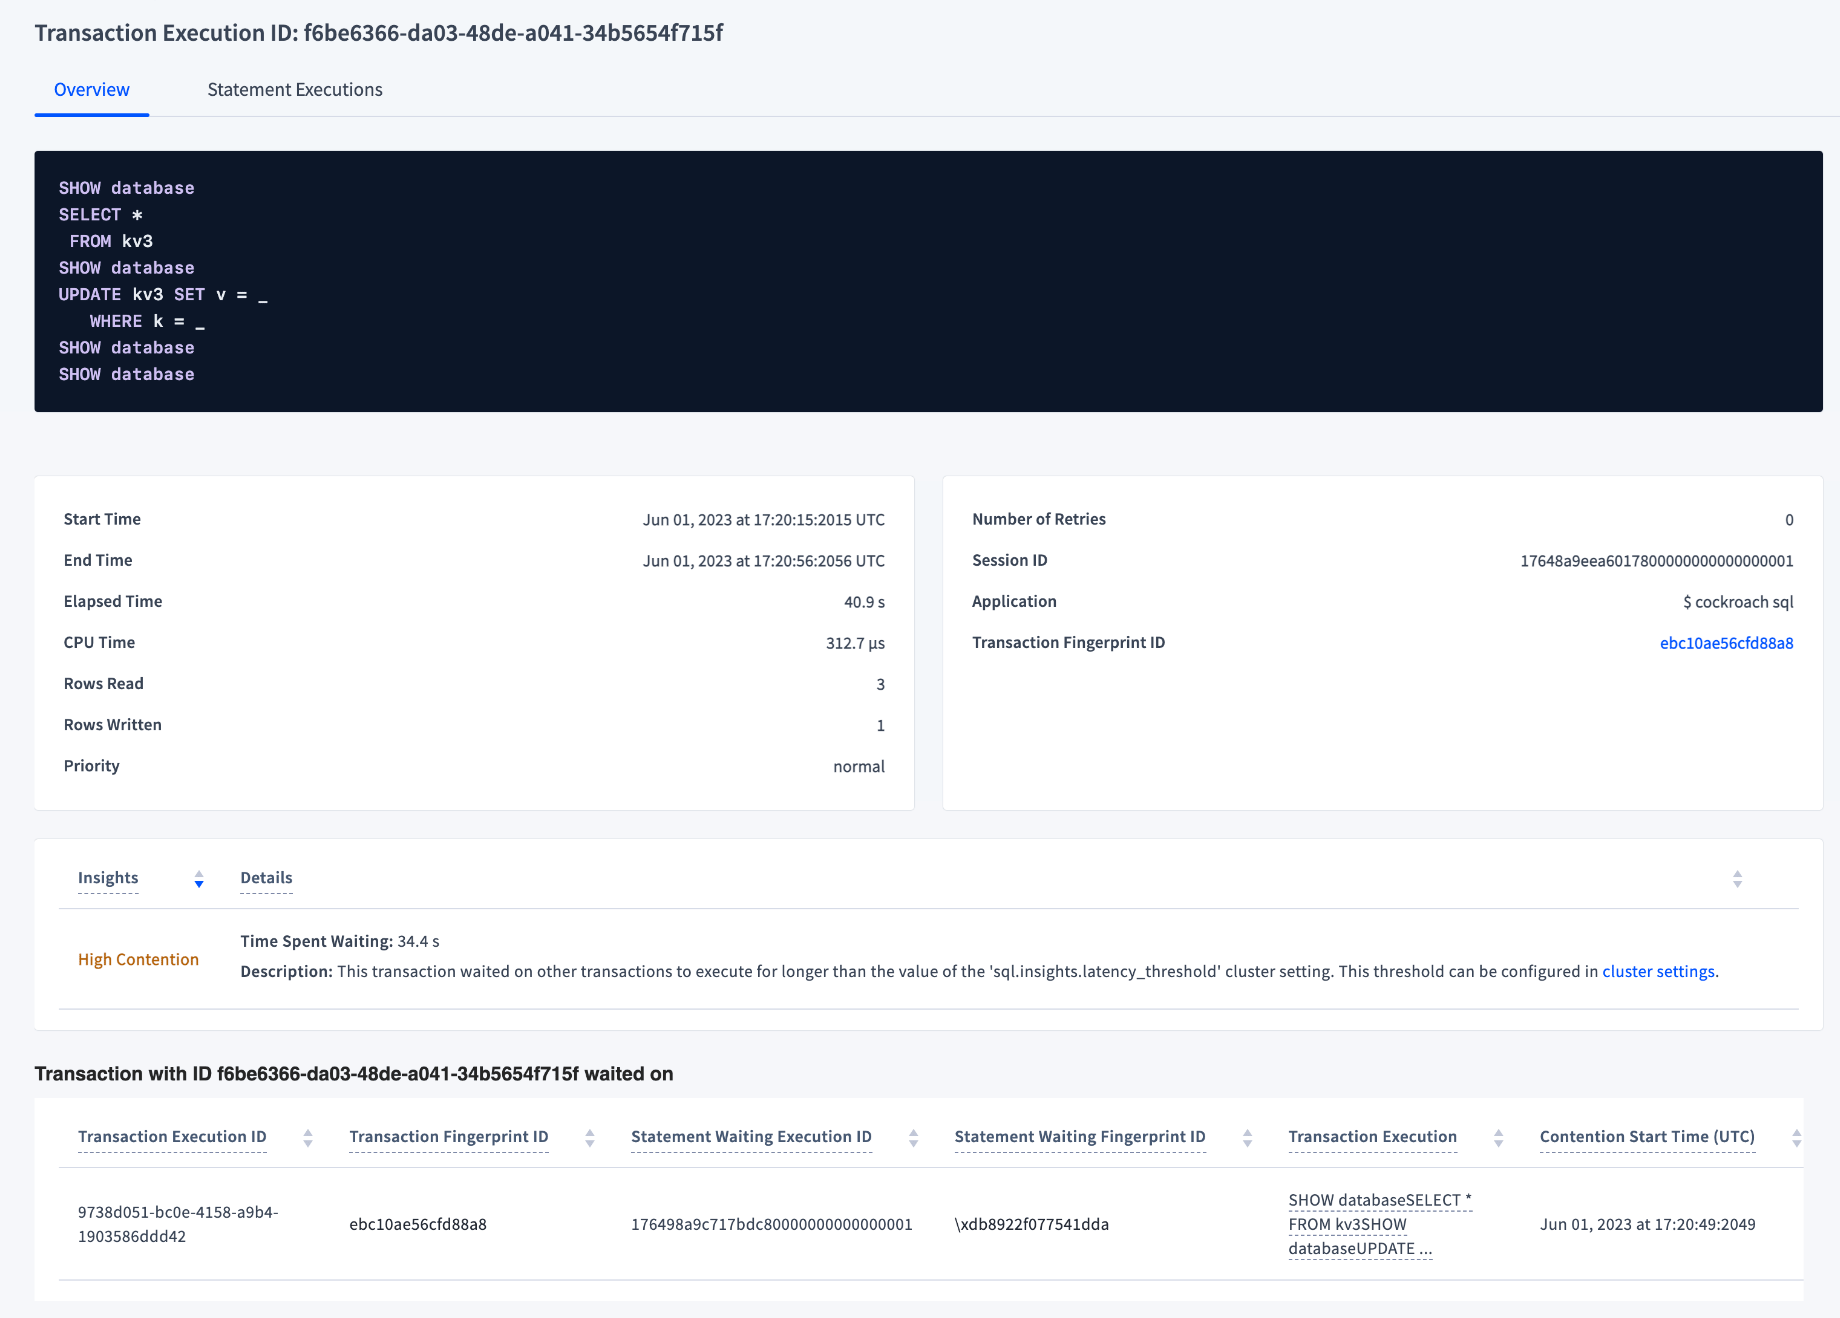
 The following screenshot shows the execution details of the preceding transaction execution:
 ### High Retry Count
The statement execution experienced a high number of retries according to the threshold set in the `sql.insights.high_retry_count.threshold` cluster setting.
### Slow Execution
The statement (or a statement in the transaction) experienced slow execution. Depending on the settings in [Configuration](#configuration), either of the following conditions trigger this insight:
* Execution time is greater than the value of the `sql.insights.latency_threshold` cluster setting.
* Anomaly detection is enabled ( `sql.insights.anomaly_detection.enabled` ), execution time is greater than the value of `sql.insights.anomaly_detection.latency_threshold`, and execution latency is greater than the p99 latency and more than double the median latency. For details, see [Detect slow executions](#detect-slow-executions).
### Suboptimal Plan
The plan could be improved for some statement(s) in the transaction execution. Possible causes include outdated statistics and missing indexes.
The statement execution has resulted in one or more [index recommendations](#schema-insights-tab) that would improve the plan.
The following screenshot shows the statement execution of the query described in Use the right index:
### High Retry Count
The statement execution experienced a high number of retries according to the threshold set in the `sql.insights.high_retry_count.threshold` cluster setting.
### Slow Execution
The statement (or a statement in the transaction) experienced slow execution. Depending on the settings in [Configuration](#configuration), either of the following conditions trigger this insight:
* Execution time is greater than the value of the `sql.insights.latency_threshold` cluster setting.
* Anomaly detection is enabled ( `sql.insights.anomaly_detection.enabled` ), execution time is greater than the value of `sql.insights.anomaly_detection.latency_threshold`, and execution latency is greater than the p99 latency and more than double the median latency. For details, see [Detect slow executions](#detect-slow-executions).
### Suboptimal Plan
The plan could be improved for some statement(s) in the transaction execution. Possible causes include outdated statistics and missing indexes.
The statement execution has resulted in one or more [index recommendations](#schema-insights-tab) that would improve the plan.
The following screenshot shows the statement execution of the query described in Use the right index:
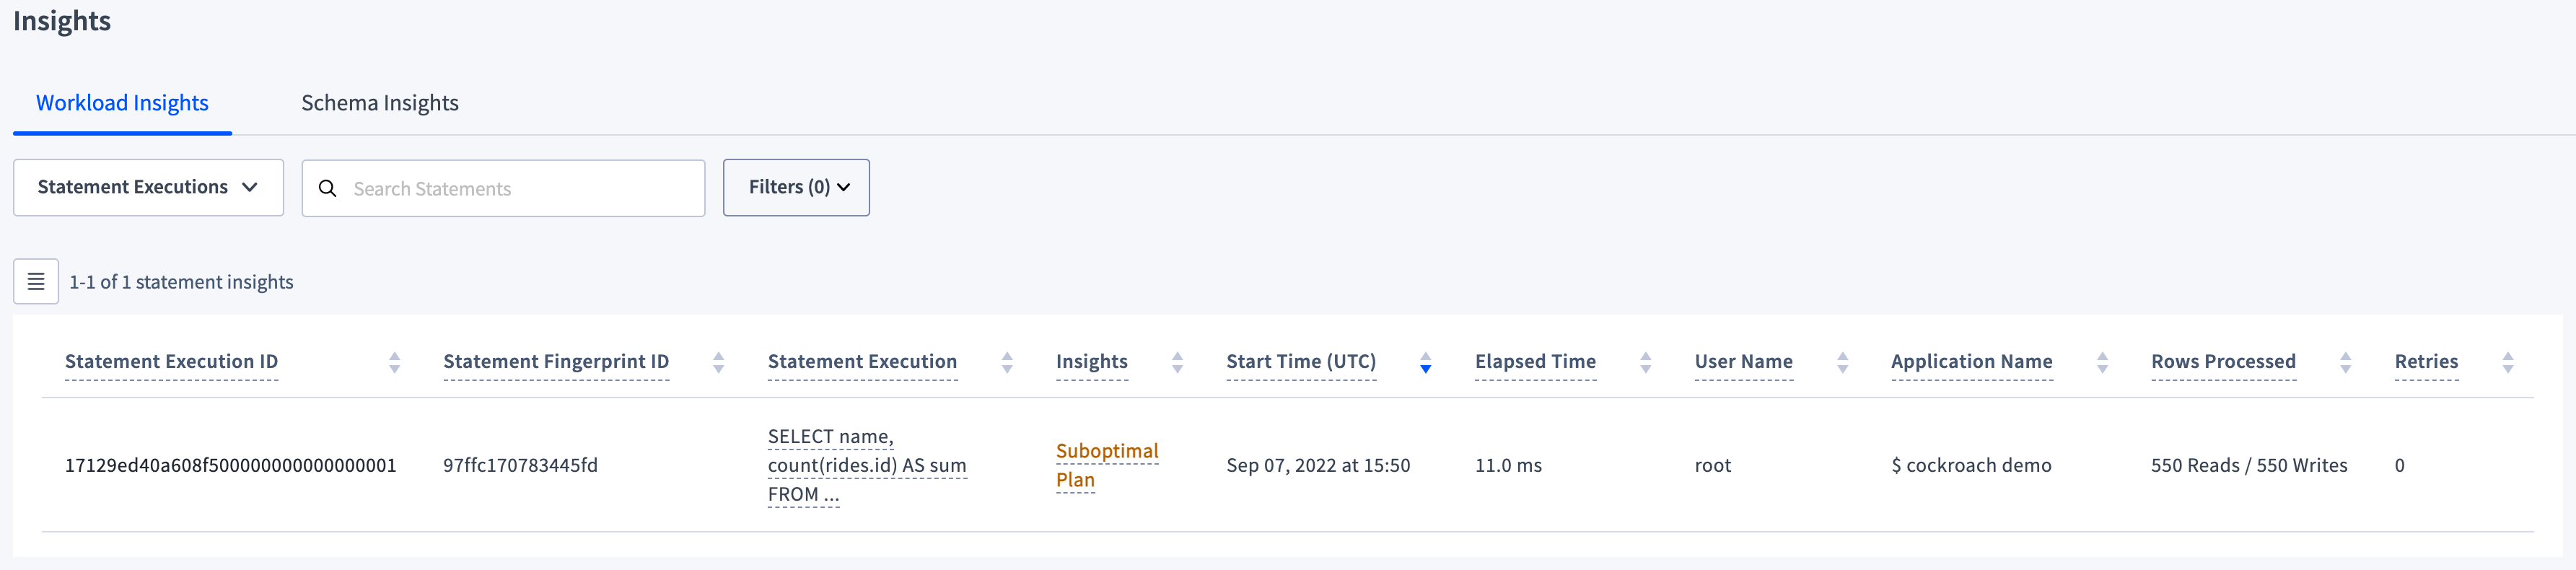 The following screenshot shows the execution details of the preceding statement execution:
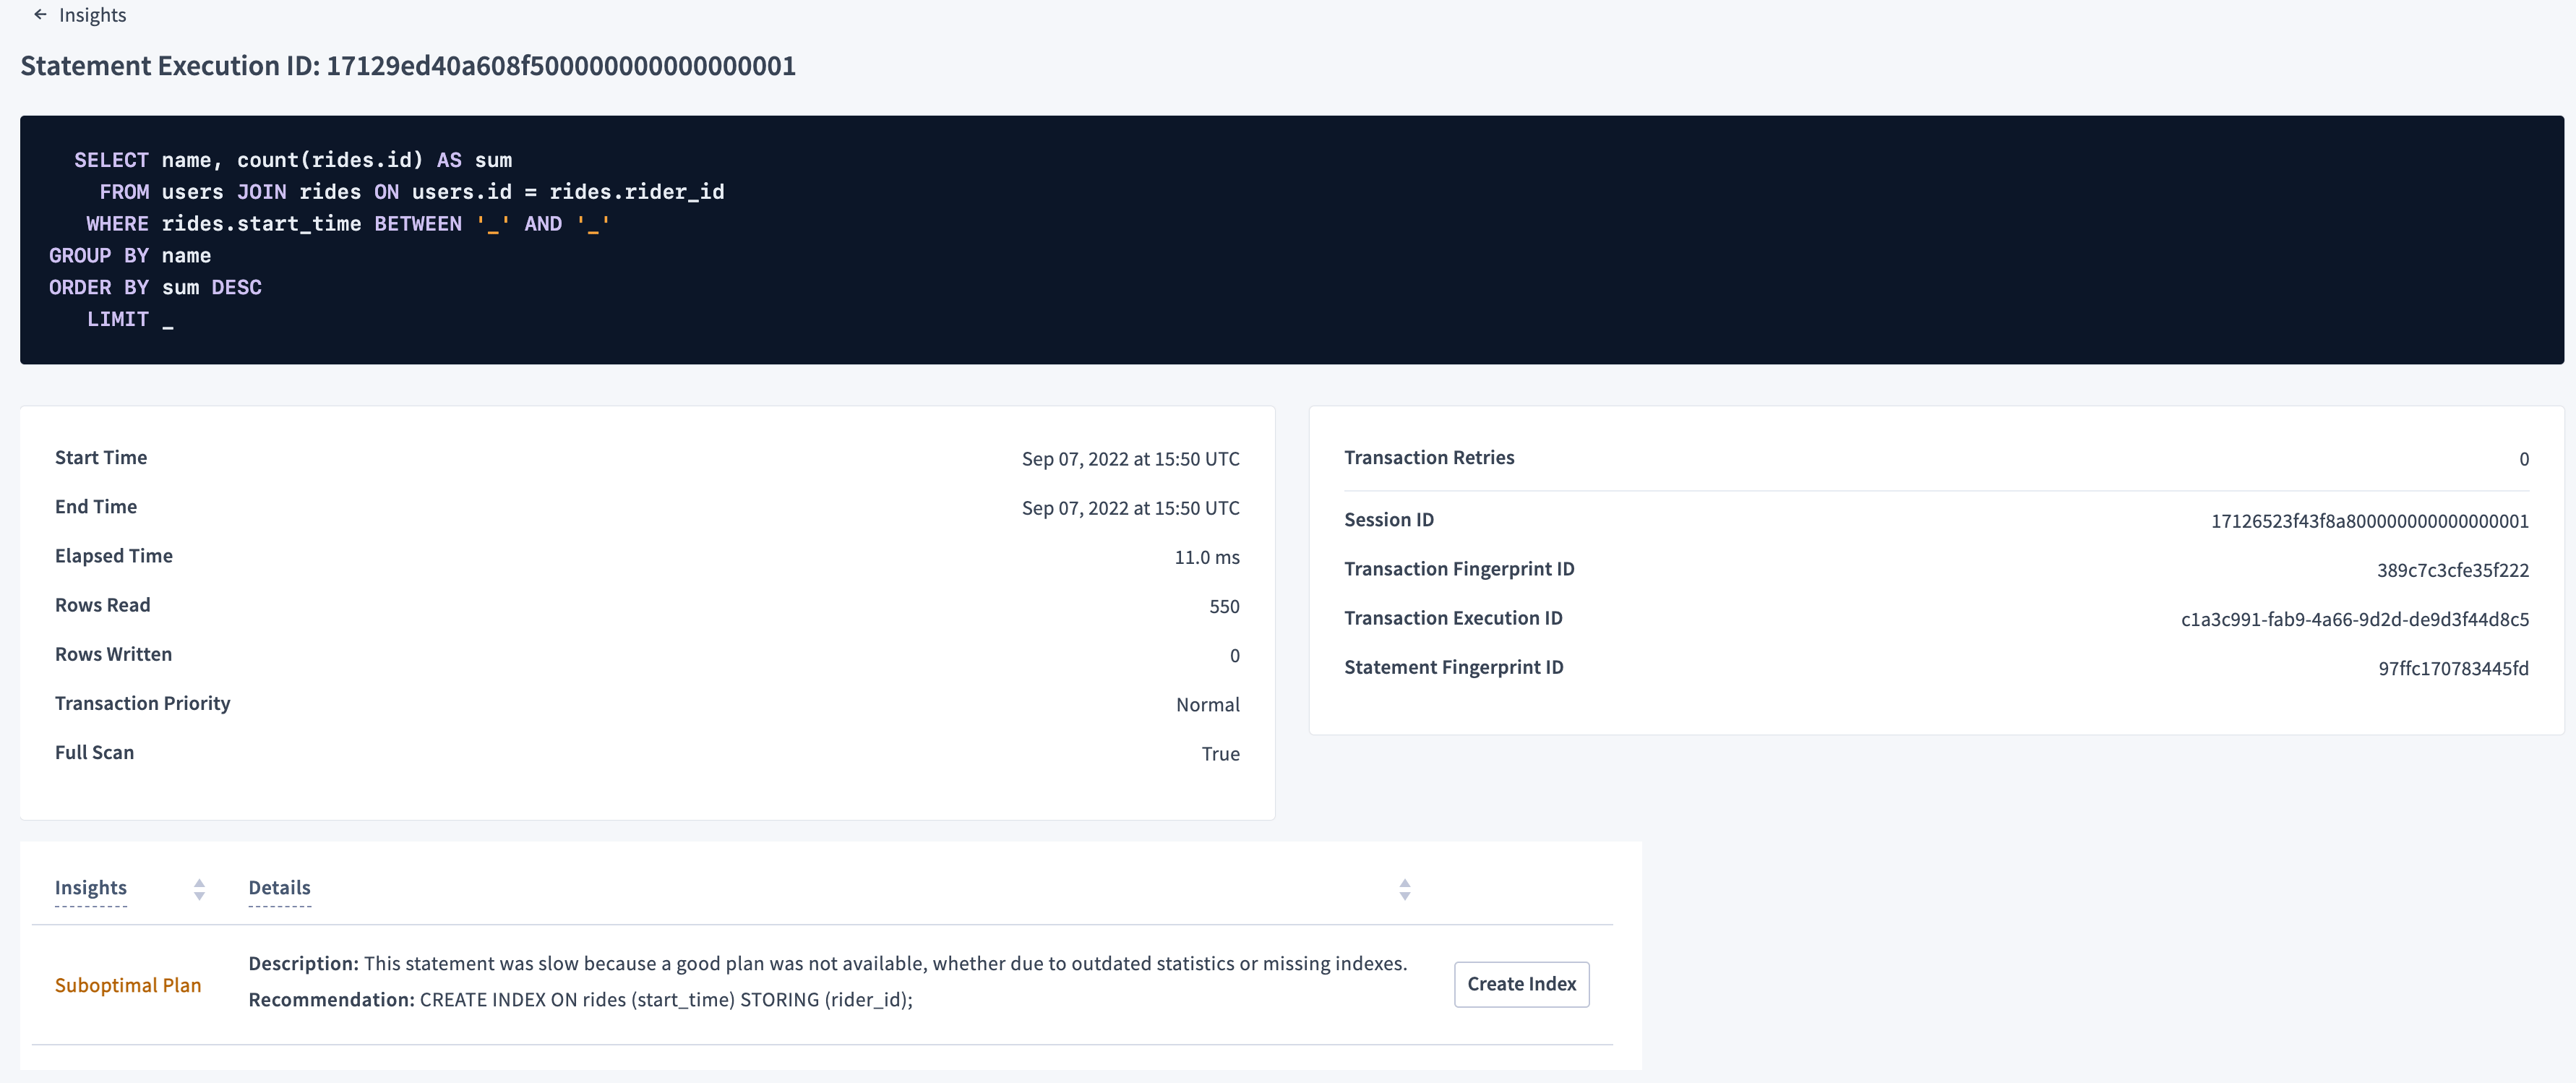 The **Insights** column shows the name of the insight, in this case **Suboptimal Plan**. The **Details** column provides details on the insight, such as a **Description** with the cause of the suboptimal plan and a **Recommendation** with a `CREATE INDEX` statement. The final column contains a **Create Index** button. Click the **Create Index** button to execute the recommended statement to mitigate the cause of the insight.
## Schema Insights tab
To display this view, click **Insights** in the left-hand navigation of the DB Console and select **Schema Insights**. This view lists the indexes that have not been used and should be dropped, and/or the ones that should be created, altered, or replaced (based on statement execution).
* The drop recommendations are the same as those on the **Databases** page.
* The create, alter, and replace recommendations are the same as those on the Explain Plans tab on the Statements page. Whereas the **Explain Plans** tab shows all recommendations, the **Schema Insights** view shows only the latest recommendations for that statement fingerprint. If you execute a statement again after creating or updating an index, the recommendation disappears.
The following screenshot shows the insight that displays after you run the query described in Use the right index 6 or more times:
The **Insights** column shows the name of the insight, in this case **Suboptimal Plan**. The **Details** column provides details on the insight, such as a **Description** with the cause of the suboptimal plan and a **Recommendation** with a `CREATE INDEX` statement. The final column contains a **Create Index** button. Click the **Create Index** button to execute the recommended statement to mitigate the cause of the insight.
## Schema Insights tab
To display this view, click **Insights** in the left-hand navigation of the DB Console and select **Schema Insights**. This view lists the indexes that have not been used and should be dropped, and/or the ones that should be created, altered, or replaced (based on statement execution).
* The drop recommendations are the same as those on the **Databases** page.
* The create, alter, and replace recommendations are the same as those on the Explain Plans tab on the Statements page. Whereas the **Explain Plans** tab shows all recommendations, the **Schema Insights** view shows only the latest recommendations for that statement fingerprint. If you execute a statement again after creating or updating an index, the recommendation disappears.
The following screenshot shows the insight that displays after you run the query described in Use the right index 6 or more times:
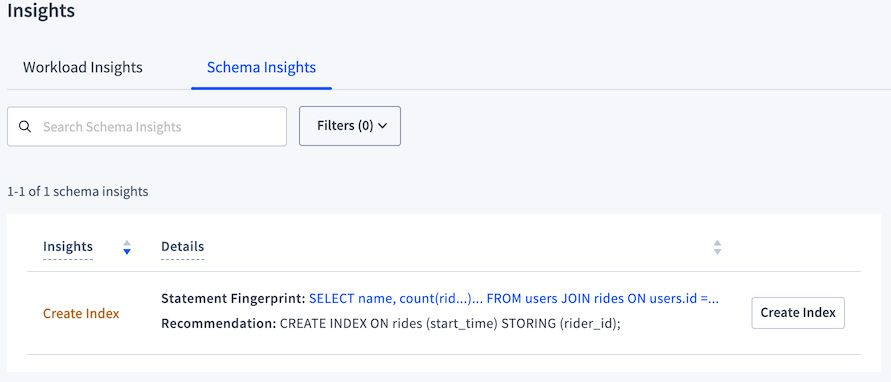 CockroachDB uses the threshold of 6 executions before offering an insight because it assumes that you are no longer merely experimenting with a query at that point.
* **Insights:** Contains one of the following insight types: **Create Index**, **Alter Index**, **Replace Index**, **Drop Unused Index**.
* **Details:** Details for each insight. Different insight types display different details fields:
* **Create Index**, **Alter Index**, or **Replace Index**: A **Statement Fingerprint** field displays the statement fingerprint that would be optimized with the creation, alteration, or replacement of the index; and a **Recommendation** field displays the SQL query to create, alter, or replace the index.
* **Drop Unused Index**: An **Index** field displays the name of the index to drop; and a **Description** field displays the reason for dropping the index.
Admin users will see an action button in the final column, which will execute the SQL statement suggested by the schema insight, for example "Create Index". Upon clicking the action button, a confirmation dialog displays a warning about the cost of online schema changes and the option to copy the SQL statement for later execution in a SQL client.
## Search and filter
By default, the Workload Insights view shows all statements or transactions that have insights. By default, the Schema Insights view shows all Schema Insights.
### Search
To search using the search field:
1. Enter a string in the search box at the top of the tab. To search for exact terms in order, wrap the search string in quotes.
2. Press `Enter`.
The list is filtered by the string.
### Time interval
In the Workload Insights view, to see transactions or statement executions within a specific time interval, select a time interval from the selector at the top of the tab. The time interval field supports preset time intervals (1 Hour, 6 Hours, 1 Day, etc.) and custom time intervals. To select a custom time interval, click the time interval field and select **Custom time interval**. In the **Start (UTC)** and **End (UTC)** fields select or type a date and time.
Use the arrow buttons to cycle through previous and next time intervals. To select the most recent interval, click **Now**. When you select a time interval, the same interval is selected in the Metrics page.
It's possible to select an interval for which no workload insights exist.
### Filter
To filter the results on the **Workload Insights** or **Schema Insights** view:
1. Click the **Filters** field.
* To filter by application, select **Application Name** and select one or more applications.
* Queries from the SQL shell are displayed under the `$ cockroach` app.
* If you haven't set `application_name` in a client connection string, it appears as `unset`.
* To filter by one or more insight types, select **Workload Insight Type** or **Schema Insight Type** and select one or more types.
2. Click **Apply**
## Configuration
You can configure the behavior of insights using the following cluster settings.
### Workload insights settings
You can configure [**Workload Insights**](#workload-insights-tab) with the following cluster settings:
| Setting | Description | Where used |
| --------------------------------------------------------------------------------------------------------- | --------------------------------------------------------------------------------------------------------------------------------------------------------------------------------------------------------------------------------------------------------------------------- | -------------------------------------------------------------------------------------------------- |
| `sql.insights.anomaly\_detection.enabled` | Whether or not anomaly insight detection is enabled. When true, CockroachDB checks if execution latency was greater than the p99 latency and more than double the median latency. | [Statement executions](#statement-executions-view) |
| `sql.insights.anomaly\_detection.latency\_threshold` | The latency threshold that triggers monitoring a statement fingerprint for unusually slow execution. | [Statement executions](#statement-executions-view) |
| `sql.insights.anomaly\_detection.memory\_limit` | The maximum amount of memory allowed for tracking statement latencies. | [Statement executions](#statement-executions-view) |
| `sql.insights.latency\_threshold` | The threshold at which the contention duration of a contended transaction is considered **High Contention** or statement execution is flagged for insights. | [Statement](#statement-executions-view) and [Transaction executions](#transaction-executions-view) |
| `sql.insights.high\_retry\_count.threshold` | The threshold at which a retry count is considered **High Retry Count**. | [Statement executions](#statement-executions-view) |
| `sql.insights.execution\_insights\_capacity` | The maximum number of execution insights stored in each node. | [Statement executions](#statement-executions-view) |
| `sql.contention.event\_store.capacity` | The in-memory storage capacity of the contention event store in each nodes. | [Transaction executions](#transaction-executions-view) |
| `sql.contention.event\_store.duration\_threshold` | The minimum contention duration to cause contention events to be collected into the `crdb\_internal.transaction\_contention\_events` table. | [Transaction executions](#transaction-executions-view) |
| `sql.contention.record\_serialization\_conflicts.enabled` | enables recording `40001` errors with conflicting txn meta as `SERIALIZATION\_CONFLICT` contention events into `crdb\_internal.transaction\_contention\_events` | [Transaction executions](#transaction-executions-view) |
#### Detect slow executions
There are two different methods for detecting slow executions. By default, they are both enabled and you can configure them based on your workload.
The first method flags all executions running longer than `sql.insights.latency_threshold`. This is analogous to checking the slow query log.
The second method attempts to detect **unusually slow executions**. You can enable this detection with `sql.insights.anomaly_detection.enabled` and configure it with `sql.insights.anomaly_detection.latency_threshold`. CockroachDB will then keep a streaming histogram in memory for each distinct statement fingerprint that has seen an execution latency longer than `sql.insights.anomaly_detection.latency_threshold`, and will flag any execution with a latency in the 99th percentile (greater than p99) for its fingerprint.
Additional controls filter out executions that are less actionable:
* The execution's latency must also be longer than twice the median latency ( `> 2*p50` ) for that fingerprint. This ensures that the elevated latency is significant enough to warrant attention.
* The execution's latency must also be longer than `sql.insights.anomaly_detection.latency_threshold`. Some executions are slower than usual, but are still fast enough for the workload.
The `sql.insights.anomaly_detection.memory_limit` cluster setting cluster setting limits the amount of memory available for tracking these streaming latency histograms. When this threshold is surpassed, the least-recently touched histogram is evicted. The default setting is sufficient for tracking about 1,000 fingerprints.
You can track the `sql.insights.anomaly_detection.memory` and `sql.insights.anomaly_detection.evictions` metrics to determine if the settings are appropriate for your workload. If you see a steady stream of evictions or churn, you can either raise the `sql.insights.anomaly_detection.memory_limit` cluster setting, to allow for more storage; or raise the `sql.insights.anomaly_detection.latency_threshold` cluster setting, to examine fewer statement fingerprints.
### Schema insights settings
You can configure the index recommendations in the [**Schema Insights** tab](#schema-insights-tab), **Explain Plans** tab, and **Databases** page with the following cluster settings:
| Setting | Description | Where used |
| ------------------------------------------------------------------------------------------------------------------------------- | ------------------------------------------------------------------------------------------------------------------ | ---------------------------------------------------------------------------------------------------------------------------------- |
| `sql.metrics.statement\_details.index\_recommendation\_collection.enabled` | Whether or not index recommendations are enabled for indexes that could be or are used during statement execution. | [Schema Insights](#schema-insights-tab) and Explain Plans tab |
| `sql.index\_recommendation.drop\_unused\_duration` | The duration of time an index must be unused before a recommendation to drop it. | [Schema Insights](#schema-insights-tab) and Databases |
| `sql.metrics.statement\_details.max\_mem\_reported\_idx\_recommendations` | The maximum number of reported index recommendations stored in memory. | [Schema Insights](#schema-insights-tab) and Explain Plans tab |
## See also
* Statements page
* Transactions page
* Databases page
* Assign privileges
CockroachDB uses the threshold of 6 executions before offering an insight because it assumes that you are no longer merely experimenting with a query at that point.
* **Insights:** Contains one of the following insight types: **Create Index**, **Alter Index**, **Replace Index**, **Drop Unused Index**.
* **Details:** Details for each insight. Different insight types display different details fields:
* **Create Index**, **Alter Index**, or **Replace Index**: A **Statement Fingerprint** field displays the statement fingerprint that would be optimized with the creation, alteration, or replacement of the index; and a **Recommendation** field displays the SQL query to create, alter, or replace the index.
* **Drop Unused Index**: An **Index** field displays the name of the index to drop; and a **Description** field displays the reason for dropping the index.
Admin users will see an action button in the final column, which will execute the SQL statement suggested by the schema insight, for example "Create Index". Upon clicking the action button, a confirmation dialog displays a warning about the cost of online schema changes and the option to copy the SQL statement for later execution in a SQL client.
## Search and filter
By default, the Workload Insights view shows all statements or transactions that have insights. By default, the Schema Insights view shows all Schema Insights.
### Search
To search using the search field:
1. Enter a string in the search box at the top of the tab. To search for exact terms in order, wrap the search string in quotes.
2. Press `Enter`.
The list is filtered by the string.
### Time interval
In the Workload Insights view, to see transactions or statement executions within a specific time interval, select a time interval from the selector at the top of the tab. The time interval field supports preset time intervals (1 Hour, 6 Hours, 1 Day, etc.) and custom time intervals. To select a custom time interval, click the time interval field and select **Custom time interval**. In the **Start (UTC)** and **End (UTC)** fields select or type a date and time.
Use the arrow buttons to cycle through previous and next time intervals. To select the most recent interval, click **Now**. When you select a time interval, the same interval is selected in the Metrics page.
It's possible to select an interval for which no workload insights exist.
### Filter
To filter the results on the **Workload Insights** or **Schema Insights** view:
1. Click the **Filters** field.
* To filter by application, select **Application Name** and select one or more applications.
* Queries from the SQL shell are displayed under the `$ cockroach` app.
* If you haven't set `application_name` in a client connection string, it appears as `unset`.
* To filter by one or more insight types, select **Workload Insight Type** or **Schema Insight Type** and select one or more types.
2. Click **Apply**
## Configuration
You can configure the behavior of insights using the following cluster settings.
### Workload insights settings
You can configure [**Workload Insights**](#workload-insights-tab) with the following cluster settings:
| Setting | Description | Where used |
| --------------------------------------------------------------------------------------------------------- | --------------------------------------------------------------------------------------------------------------------------------------------------------------------------------------------------------------------------------------------------------------------------- | -------------------------------------------------------------------------------------------------- |
| `sql.insights.anomaly\_detection.enabled` | Whether or not anomaly insight detection is enabled. When true, CockroachDB checks if execution latency was greater than the p99 latency and more than double the median latency. | [Statement executions](#statement-executions-view) |
| `sql.insights.anomaly\_detection.latency\_threshold` | The latency threshold that triggers monitoring a statement fingerprint for unusually slow execution. | [Statement executions](#statement-executions-view) |
| `sql.insights.anomaly\_detection.memory\_limit` | The maximum amount of memory allowed for tracking statement latencies. | [Statement executions](#statement-executions-view) |
| `sql.insights.latency\_threshold` | The threshold at which the contention duration of a contended transaction is considered **High Contention** or statement execution is flagged for insights. | [Statement](#statement-executions-view) and [Transaction executions](#transaction-executions-view) |
| `sql.insights.high\_retry\_count.threshold` | The threshold at which a retry count is considered **High Retry Count**. | [Statement executions](#statement-executions-view) |
| `sql.insights.execution\_insights\_capacity` | The maximum number of execution insights stored in each node. | [Statement executions](#statement-executions-view) |
| `sql.contention.event\_store.capacity` | The in-memory storage capacity of the contention event store in each nodes. | [Transaction executions](#transaction-executions-view) |
| `sql.contention.event\_store.duration\_threshold` | The minimum contention duration to cause contention events to be collected into the `crdb\_internal.transaction\_contention\_events` table. | [Transaction executions](#transaction-executions-view) |
| `sql.contention.record\_serialization\_conflicts.enabled` | enables recording `40001` errors with conflicting txn meta as `SERIALIZATION\_CONFLICT` contention events into `crdb\_internal.transaction\_contention\_events` | [Transaction executions](#transaction-executions-view) |
#### Detect slow executions
There are two different methods for detecting slow executions. By default, they are both enabled and you can configure them based on your workload.
The first method flags all executions running longer than `sql.insights.latency_threshold`. This is analogous to checking the slow query log.
The second method attempts to detect **unusually slow executions**. You can enable this detection with `sql.insights.anomaly_detection.enabled` and configure it with `sql.insights.anomaly_detection.latency_threshold`. CockroachDB will then keep a streaming histogram in memory for each distinct statement fingerprint that has seen an execution latency longer than `sql.insights.anomaly_detection.latency_threshold`, and will flag any execution with a latency in the 99th percentile (greater than p99) for its fingerprint.
Additional controls filter out executions that are less actionable:
* The execution's latency must also be longer than twice the median latency ( `> 2*p50` ) for that fingerprint. This ensures that the elevated latency is significant enough to warrant attention.
* The execution's latency must also be longer than `sql.insights.anomaly_detection.latency_threshold`. Some executions are slower than usual, but are still fast enough for the workload.
The `sql.insights.anomaly_detection.memory_limit` cluster setting cluster setting limits the amount of memory available for tracking these streaming latency histograms. When this threshold is surpassed, the least-recently touched histogram is evicted. The default setting is sufficient for tracking about 1,000 fingerprints.
You can track the `sql.insights.anomaly_detection.memory` and `sql.insights.anomaly_detection.evictions` metrics to determine if the settings are appropriate for your workload. If you see a steady stream of evictions or churn, you can either raise the `sql.insights.anomaly_detection.memory_limit` cluster setting, to allow for more storage; or raise the `sql.insights.anomaly_detection.latency_threshold` cluster setting, to examine fewer statement fingerprints.
### Schema insights settings
You can configure the index recommendations in the [**Schema Insights** tab](#schema-insights-tab), **Explain Plans** tab, and **Databases** page with the following cluster settings:
| Setting | Description | Where used |
| ------------------------------------------------------------------------------------------------------------------------------- | ------------------------------------------------------------------------------------------------------------------ | ---------------------------------------------------------------------------------------------------------------------------------- |
| `sql.metrics.statement\_details.index\_recommendation\_collection.enabled` | Whether or not index recommendations are enabled for indexes that could be or are used during statement execution. | [Schema Insights](#schema-insights-tab) and Explain Plans tab |
| `sql.index\_recommendation.drop\_unused\_duration` | The duration of time an index must be unused before a recommendation to drop it. | [Schema Insights](#schema-insights-tab) and Databases |
| `sql.metrics.statement\_details.max\_mem\_reported\_idx\_recommendations` | The maximum number of reported index recommendations stored in memory. | [Schema Insights](#schema-insights-tab) and Explain Plans tab |
## See also
* Statements page
* Transactions page
* Databases page
* Assign privileges