> ## Documentation Index
> Fetch the complete documentation index at: https://cockroachlabs.mintlify.site/llms.txt
> Use this file to discover all available pages before exploring further.
# Networking Dashboard
export const InternalLink = ({version, path = "", children, ...props}) => {
let detectedVersion = version || "stable";
if (typeof window !== 'undefined' && !version) {
const match = window.location.pathname.match(/\/docs\/([^/]+)/);
if (match) {
detectedVersion = match[1];
}
}
const normalizedPath = path.startsWith("/") ? path.slice(1) : path;
return
{children}
;
};
The **Networking** dashboard lets you monitor the networking of your cluster. This includes network traffic.
To view this dashboard, access the DB Console, click **Metrics** in the left-hand navigation, and select **Dashboard** > **Networking**.
For additional information about node connectivity conditions, refer to the Network page.
## Dashboard navigation
Use the **Graph** menu to display metrics for your entire cluster or for a specific node.
To the right of the Graph and Dashboard menus, a time interval selector allows you to filter the view for a predefined or custom time interval. Use the navigation buttons to move to the previous, next, or current time interval. When you select a time interval, the same interval is selected in the SQL Activity pages. However, if you select 10 or 30 minutes, the interval defaults to 1 hour in SQL Activity pages.
Hovering your mouse pointer over the graph title will display a tooltip with a description and the metrics used to create the graph.
When hovering on graphs, crosshair lines will appear at your mouse pointer. The series' values corresponding to the given time in the cross hairs are displayed in the legend under the graph. Hovering the mouse pointer on a given series displays the corresponding value near the mouse pointer and highlights the series line (graying out other series lines). Click anywhere within the graph to freeze the values in place. Click anywhere within the graph again to cause the values to change with your mouse movements once more.
In the legend, click on an individual series to isolate it on the graph. The other series will be hidden, while the hover will still work. Click the individual series again to make the other series visible. If there are many series, a scrollbar may appear on the right of the legend. This is to limit the size of the legend so that it does not get endlessly large, particularly on clusters with many nodes.
The **Networking** dashboard displays the following time series graphs:
## Network Bytes Received
* In the node view, the graph shows the 10-second average of the number of network bytes received per second for all processes, including `cockroach`, on the node.
* In the cluster view, the graph shows the 10-second average of the number of network bytes received for all processes, including `cockroach`, per second across all nodes.
Metric: `sys.host.net.recv.bytes` Bytes received on all network interfaces since the `cockroach` process started
## Network Packets Received
* In the node view, the graph shows the packets received on all network interfaces since the `cockroach` process started on the node.
* In the cluster view, the graph shows the packets received on all network interfaces since the `cockroach` process started on each node in the cluster.
Metric: `sys.host.net.recv.packets`
## Network Packet Errors on Receive
* In the node view, the graph shows the errors on receiving packets on all network interfaces since the `cockroach` process started on the node.
* In the cluster view, the graph shows the errors on receiving packets on all network interfaces since the `cockroach` process started on each node in the cluster.
Metric: `sys.host.net.recv.err`
## Network Packet Drops on Receive
* In the node view, the graph shows received packets that were dropped on all network interfaces since the `cockroach` process started on the node.
* In the cluster view, the graph shows received packets that were dropped on all network interfaces since the `cockroach` process started on each node in the cluster.
Metric: `sys.host.net.recv.drop`
## Network Bytes Sent
* In the node view, the graph shows the 10-second average of the number of network bytes sent per second by all processes, including `cockroach`, on the node.
* In the cluster view, the graph shows the 10-second average of the number of network bytes sent per second by all processes, including `cockroach`, across all nodes.
Metric: `sys.host.net.send.bytes` Bytes sent on all network interfaces since the `cockroach` process started
## Network Packets Sent
* In the node view, the graph shows packets sent on all network interfaces since the `cockroach` process started on the node.
* In the cluster view,the graph shows packets sent on all network interfaces since the `cockroach` process started on each node in the cluster.
Metric: `sys.host.net.send.packets`
## Network Packet Errors on Send
* In the node view, the graph shows the errors on sending packets on all network interfaces since the `cockroach` process started on the node.
* In the cluster view,the graph shows the errors on sending packets on all network interfaces since the `cockroach` process started on each node in the cluster.
Metric: `sys.host.net.send.err`
## Network Packet Drops on Send
* In the node view, the graph shows sent packets that were dropped on all network interfaces since the `cockroach` process started on the node.
* In the cluster view,the graph shows sent packets that were dropped on all network interfaces since the `cockroach` process started on each node in the cluster.
Metric: `sys.host.net.send.drop`
## RPC Heartbeat Latency: 50th percentile
RPC heartbeat latency is the round-trip latency for recent successful outgoing heartbeats. It is the distribution of round-trip latencies with other nodes. This only reflects successful heartbeats and measures gRPC overhead as well as possible [head-of-line blocking](https://wikipedia.org/wiki/Head-of-line_blocking). Elevated values in this metric may hint at network issues or saturation or both, but they are not proof of them. CPU overload can similarly elevate this metric. To conclusively diagnose network issues, look at OS-level metrics such as packet loss and retransmits. Heartbeats are not very frequent (every 1 second), so they may not capture rare or short-lived degradations.
* In the node view, the graph shows the 50th [percentile](https://wikipedia.org/wiki/Percentile#The_normal_distribution_and_percentiles) of RPC heartbeat latency for the node.
* In the cluster view, the graph shows the 50th [percentile](https://wikipedia.org/wiki/Percentile#The_normal_distribution_and_percentiles) of RPC heartbeat latency across all nodes in the cluster. There are lines for each node in the cluster.
Metric: `round-trip-latency-p50`
## RPC Heartbeat Latency: 99th percentile
RPC heartbeat latency is the round-trip latency for recent successful outgoing heartbeats. It is the distribution of round-trip latencies with other nodes. This only reflects successful heartbeats and measures gRPC overhead as well as possible [head-of-line blocking](https://wikipedia.org/wiki/Head-of-line_blocking). Elevated values in this metric may hint at network issues or saturation or both, but they are not proof of them. CPU overload can similarly elevate this metric. To conclusively diagnose network issues, look at OS-level metrics such as packet loss and retransmits. Heartbeats are not very frequent (every 1 second), so they may not capture rare or short-lived degradations.
* In the node view, the graph shows the 99th [percentile](https://wikipedia.org/wiki/Percentile#The_normal_distribution_and_percentiles) of RPC heartbeat latency for the node.
* In the cluster view, the graph shows the 99th [percentile](https://wikipedia.org/wiki/Percentile#The_normal_distribution_and_percentiles) of RPC heartbeat latency across all nodes in the cluster. There are lines for each node in the cluster.
Metric: `round-trip-latency-p99`
## Unhealthy RPC Connections
A healthy RPC connection is one that is “bidirectionally connected” and "heartbeating". For example, if Node 1 sends a request to Node 2 and Node 2 dials back (sends request back to Node 1), it ensures that communication is healthy in both directions. This graph shows the number of connections in an unhealthy state.
* In the node view, the graph shows the number of outgoing connections on a node that are in an unhealthy state.
* In the cluster view, the graph shows the number of outgoing connections on each node that are in an unhealthy state.
Metric: `rpc.connection.unhealthy` Gauge of current connections in an unhealthy state (not bidirectionally connected or heartbeating)
## Summary and events
### Summary panel
A **Summary** panel of key metrics is displayed to the right of the timeseries graphs.
| Metric | Description |
| ------------------ | ---------------------------------------------------------------------------------------------------------------------------------------------------------------------- |
| Total Nodes | The total number of nodes in the cluster. Decommissioned nodes are not included in this count. |
| Capacity Used | The storage capacity used as a percentage of usable capacity allocated across all nodes. |
| Unavailable Ranges | The number of unavailable ranges in the cluster. A non-zero number indicates an unstable cluster. |
| Queries per second | The total number of `SELECT`, `UPDATE`, `INSERT`, and `DELETE` queries executed per second across the cluster. |
| P99 Latency | The 99th percentile of service latency. |
If you are testing your deployment locally with multiple CockroachDB nodes running on a single machine (this is not recommended in production), you must explicitly set the store size per node in order to display the correct capacity. Otherwise, the machine's actual disk capacity will be counted as a separate store for each node, thus inflating the computed capacity.
### Events panel
Underneath the [Summary](#summary-panel) panel, the **Events** panel lists the 5 most recent events logged for all nodes across the cluster. To list all events, click **View all events**.
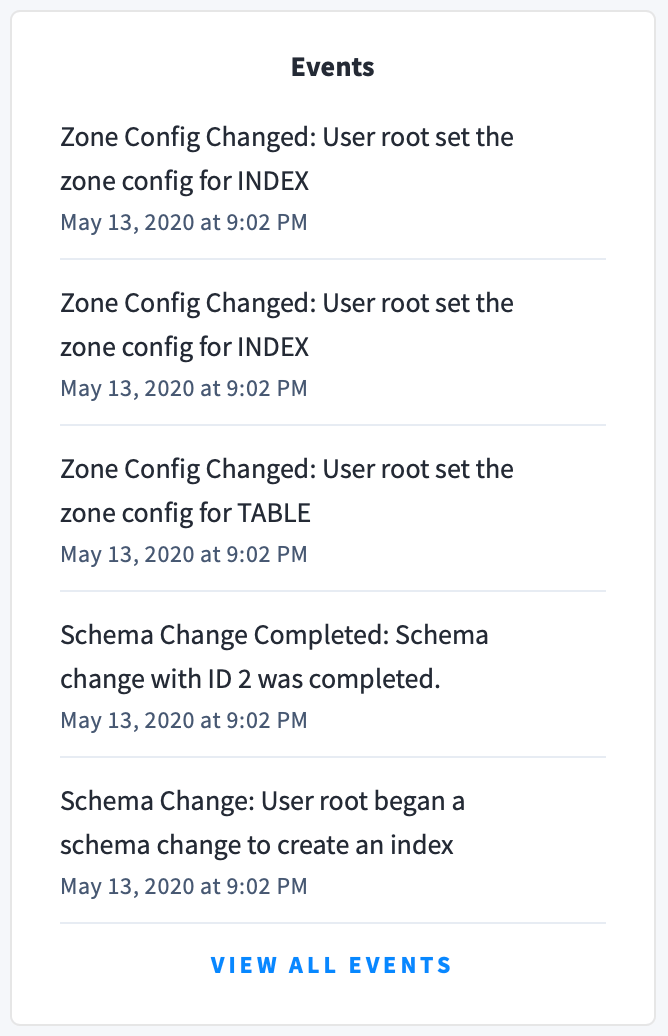 The following types of events are listed:
* Database created
* Database dropped
* Table created
* Table dropped
* Table altered
* Index created
* Index dropped
* View created
* View dropped
* Schema change reversed
* Schema change finished
* Node joined
* Node decommissioned
* Node restarted
* Cluster setting changed
## See also
* Troubleshooting Overview
* Support Resources
* Raw Status Endpoints
The following types of events are listed:
* Database created
* Database dropped
* Table created
* Table dropped
* Table altered
* Index created
* Index dropped
* View created
* View dropped
* Schema change reversed
* Schema change finished
* Node joined
* Node decommissioned
* Node restarted
* Cluster setting changed
## See also
* Troubleshooting Overview
* Support Resources
* Raw Status Endpoints