> ## Documentation Index
> Fetch the complete documentation index at: https://cockroachlabs.mintlify.site/llms.txt
> Use this file to discover all available pages before exploring further.
# Log SQL Activity to Datadog
export const InternalLink = ({version, path = "", children, ...props}) => {
let detectedVersion = version || "stable";
if (typeof window !== 'undefined' && !version) {
const match = window.location.pathname.match(/\/docs\/([^/]+)/);
if (match) {
detectedVersion = match[1];
}
}
const normalizedPath = path.startsWith("/") ? path.slice(1) : path;
return
{children}
;
};
export const version = "v24.1";
This tutorial describes how to configure logging of telemetry events, including `sampled_query` and `sampled_transaction`, to [Datadog](https://www.datadoghq.com/) for finer granularity and long-term retention of SQL activity. The `sampled_query` and `sampled_transaction` events contain common SQL event and execution details for statements and transactions.
CockroachDB supports a built-in integration with Datadog which sends these events as logs via the [Datadog HTTP API](https://docs.datadoghq.com/api/latest/logs). This integration is the recommended path to achieve high throughput data ingestion, which will in turn provide more query and transaction events for greater workload observability.
**This feature is in preview** and subject to change. To share feedback and/or issues, contact [Support](https://support.cockroachlabs.com).
## Step 1. Create a Datadog API key
1. In Datadog, navigate to [**Organization Settings > API keys**](https://app.datadoghq.com/organization-settings/api-keys).
2. Follow the steps in the Datadog documentation on how to [add an API key](https://docs.datadoghq.com/account_management/api-app-keys#add-an-api-key-or-client-token).
3. Copy the newly created API key to be used in Step 2.
## Step 2. Configure an HTTP network collector for Datadog
Configure an HTTP network collector by creating or modifying the `logs.yaml` file.
In this `logs.yaml` example:
1. To send telemetry events directly to Datadog without writing events to disk, override telemetry default configuration by setting `file-groups: telemetry: channels:` to `[]`.
Given the [volume of `sampled_query` and `sampled_transaction` events](#step-3-configure-cockroachdb-to-emit-query-events), do not write these events to disk, or `file-groups`. Writing a high volume of `sampled_query` and `sampled_transaction` events to a file group will unnecessarily consume cluster resources and impact workload performance.
To disable the creation of a telemetry file and avoid writing `sampled_query` and `sampled_transaction` events and other telemetry events to disk, change the telemetry `file-groups` setting from the default of `channels: [TELEMETRY]` to `channels: []`.
2. To connect to Datadog, replace {'{DATADOG API KEY}'} with the value you copied in Step 1.
3. To control the ingestion and potential drop rate for telemetry events, configure the following `buffering` values depending on your workload:
* `max-staleness`: The maximum time a log message will wait in the buffer before a flush is triggered. Set to `0` to disable flushing based on elapsed time. Default: `5s`
* `flush-trigger-size`: The number of bytes that will trigger the buffer to flush. Set to `0` to disable flushing based on accumulated size. Default: `1MiB`. In this example, override to `2.5MiB`.
* `max-buffer-size`: The maximum size of the buffer: new log messages received when the buffer is full cause older messages to be dropped. Default: `50MiB`
```yaml theme={"theme":{"light":"catppuccin-mocha","dark":"catppuccin-mocha"}}
sinks:
http-servers:
datadog:
channels: [TELEMETRY]
address: https://http-intake.logs.datadoghq.com/api/v2/logs
format: json
method: POST
compression: gzip
headers: {DD-API-KEY: "DATADOG_API_KEY"} # replace with actual DATADOG API key
buffering:
format: json-array
max-staleness: 5s
flush-trigger-size: 2.5MiB # override default value
max-buffer-size: 50MiB
file-groups: # override default configuration
telemetry: # do not write telemetry events to disk
channels: [] # set to empty square brackets
```
If you prefer to keep the `DD-API-KEY` in a file other than the `logs.yaml`, replace the `headers` parameter with the `file-based-headers` parameter:
```yaml theme={"theme":{"light":"catppuccin-mocha","dark":"catppuccin-mocha"}}
file-based-headers: {DD-API-KEY: "path/to/file"} # replace with path of file containing DATADOG API key
```
The value in the file containing the Datadog API key can be updated without restarting the `cockroach` process. Instead, send SIGHUP to the `cockroach` process to notify it to refresh the value.
Pass the `logs.yaml` file to the `cockroach` process with either `--log-config-file` or `--log` flag.
## Step 3. Configure CockroachDB to emit query events
Enable the `sql.telemetry.query_sampling.enabled` cluster setting so that executed queries will emit an event on the telemetry logging channel:
```sql theme={"theme":{"light":"catppuccin-mocha","dark":"catppuccin-mocha"}}
SET CLUSTER SETTING sql.telemetry.query_sampling.enabled = true;
```
Set the `sql.telemetry.query_sampling.mode` cluster setting to `statement` so that `sampled_query` events are emitted (`sampled_transaction` events will not be emitted):
```sql theme={"theme":{"light":"catppuccin-mocha","dark":"catppuccin-mocha"}}
SET CLUSTER SETTING sql.telemetry.query_sampling.mode = 'statement';
```
Configure the following cluster setting to a value that is dependent on the level of granularity you require and how much performance impact from frequent logging you can tolerate:
* `sql.telemetry.query_sampling.max_event_frequency` (default `8`) is the max event frequency (events per second) at which we sample executed queries for telemetry. If sampling mode is set to `'transaction'`, this setting is ignored. In practice, this means that we only sample an executed query if 1/`max_event_frequency` seconds have elapsed since the last executed query was sampled. Sampling impacts the volume of query events emitted which can have downstream impact to workload performance and third-party processing costs. Slowly increase this sampling threshold and monitor potential impact.
Logs are sampled for statements of type DML (data manipulation language) or TCL (transaction control language).
Logs are always captured for statements under the following conditions:
* Statements that are not of type DML (data manipulation language) or TCL (transaction control language). These statement types are:
* DDL (data definition language)
* DCL (data control language)
* Statements that are in sessions with tracing enabled.
* Statements that are from the DB Console when cluster setting `sql.telemetry.query_sampling.internal_console.enabled` is `true` (default). These events have `ApplicationName` set to `$ internal-console`.
The `sql.telemetry.query_sampling.max_event_frequency` cluster setting and the `buffering` options in the `logs.yaml` control how many events are emitted to Datadog and that can be potentially dropped. Adjust this setting and these options according to your workload, depending on the size of events and the queries per second (QPS) observed through monitoring.
## Step 4. Configure CockroachDB to emit query and transaction events (optional)
Enable the `sql.telemetry.query_sampling.enabled` cluster setting so that executed queries and transactions will emit an event on the telemetry logging channel:
```sql theme={"theme":{"light":"catppuccin-mocha","dark":"catppuccin-mocha"}}
SET CLUSTER SETTING sql.telemetry.query_sampling.enabled = true;
```
Set the `sql.telemetry.query_sampling.mode` cluster setting to `transaction` so that `sampled_query` and `sampled_transaction` events are emitted:
```sql theme={"theme":{"light":"catppuccin-mocha","dark":"catppuccin-mocha"}}
SET CLUSTER SETTING sql.telemetry.query_sampling.mode = 'transaction';
```
Configure the following cluster settings to values that are dependent on the level of granularity you require and how much performance impact from frequent logging you can tolerate:
* `sql.telemetry.transaction_sampling.max_event_frequency` (default `8` ) is the max event frequency (events per second) at which we sample transactions for telemetry. If sampling mode is set to `'statement'`, this setting is ignored. In practice, this means that we only sample a transaction if 1/ `max_event_frequency` seconds have elapsed since the last transaction was sampled. Sampling impacts the volume of transaction events emitted which can have downstream impact to workload performance and third-party processing costs. Slowly increase this sampling threshold and monitor potential impact.
* `sql.telemetry.transaction_sampling.statement_events_per_transaction.max` (default `50`) is the maximum number of statement events to log for every sampled transaction. Note that statements that are always captured do not adhere to this limit.
Logs are always captured for statements under the following conditions:
* Statements that are not of type DML (data manipulation language) or TCL (transaction control language). These statement types are:
* DDL (data definition language)
* DCL (data control language)
* Statements that are in sessions with tracing enabled.
* Statements that are from the DB Console when cluster setting `sql.telemetry.query_sampling.internal_console.enabled` is `true` (default). These events have `ApplicationName` set to `$ internal-console`.
### Correlating query events with a specific transaction
Each `sampled_query` and `sampled_transaction` event has an `event.TransactionID` attribute. To correlate a `sampled_query` with a specific `sampled_transaction`, filter for a given value of this attribute.
## Step 5. Monitor TELEMETRY logs in Datadog
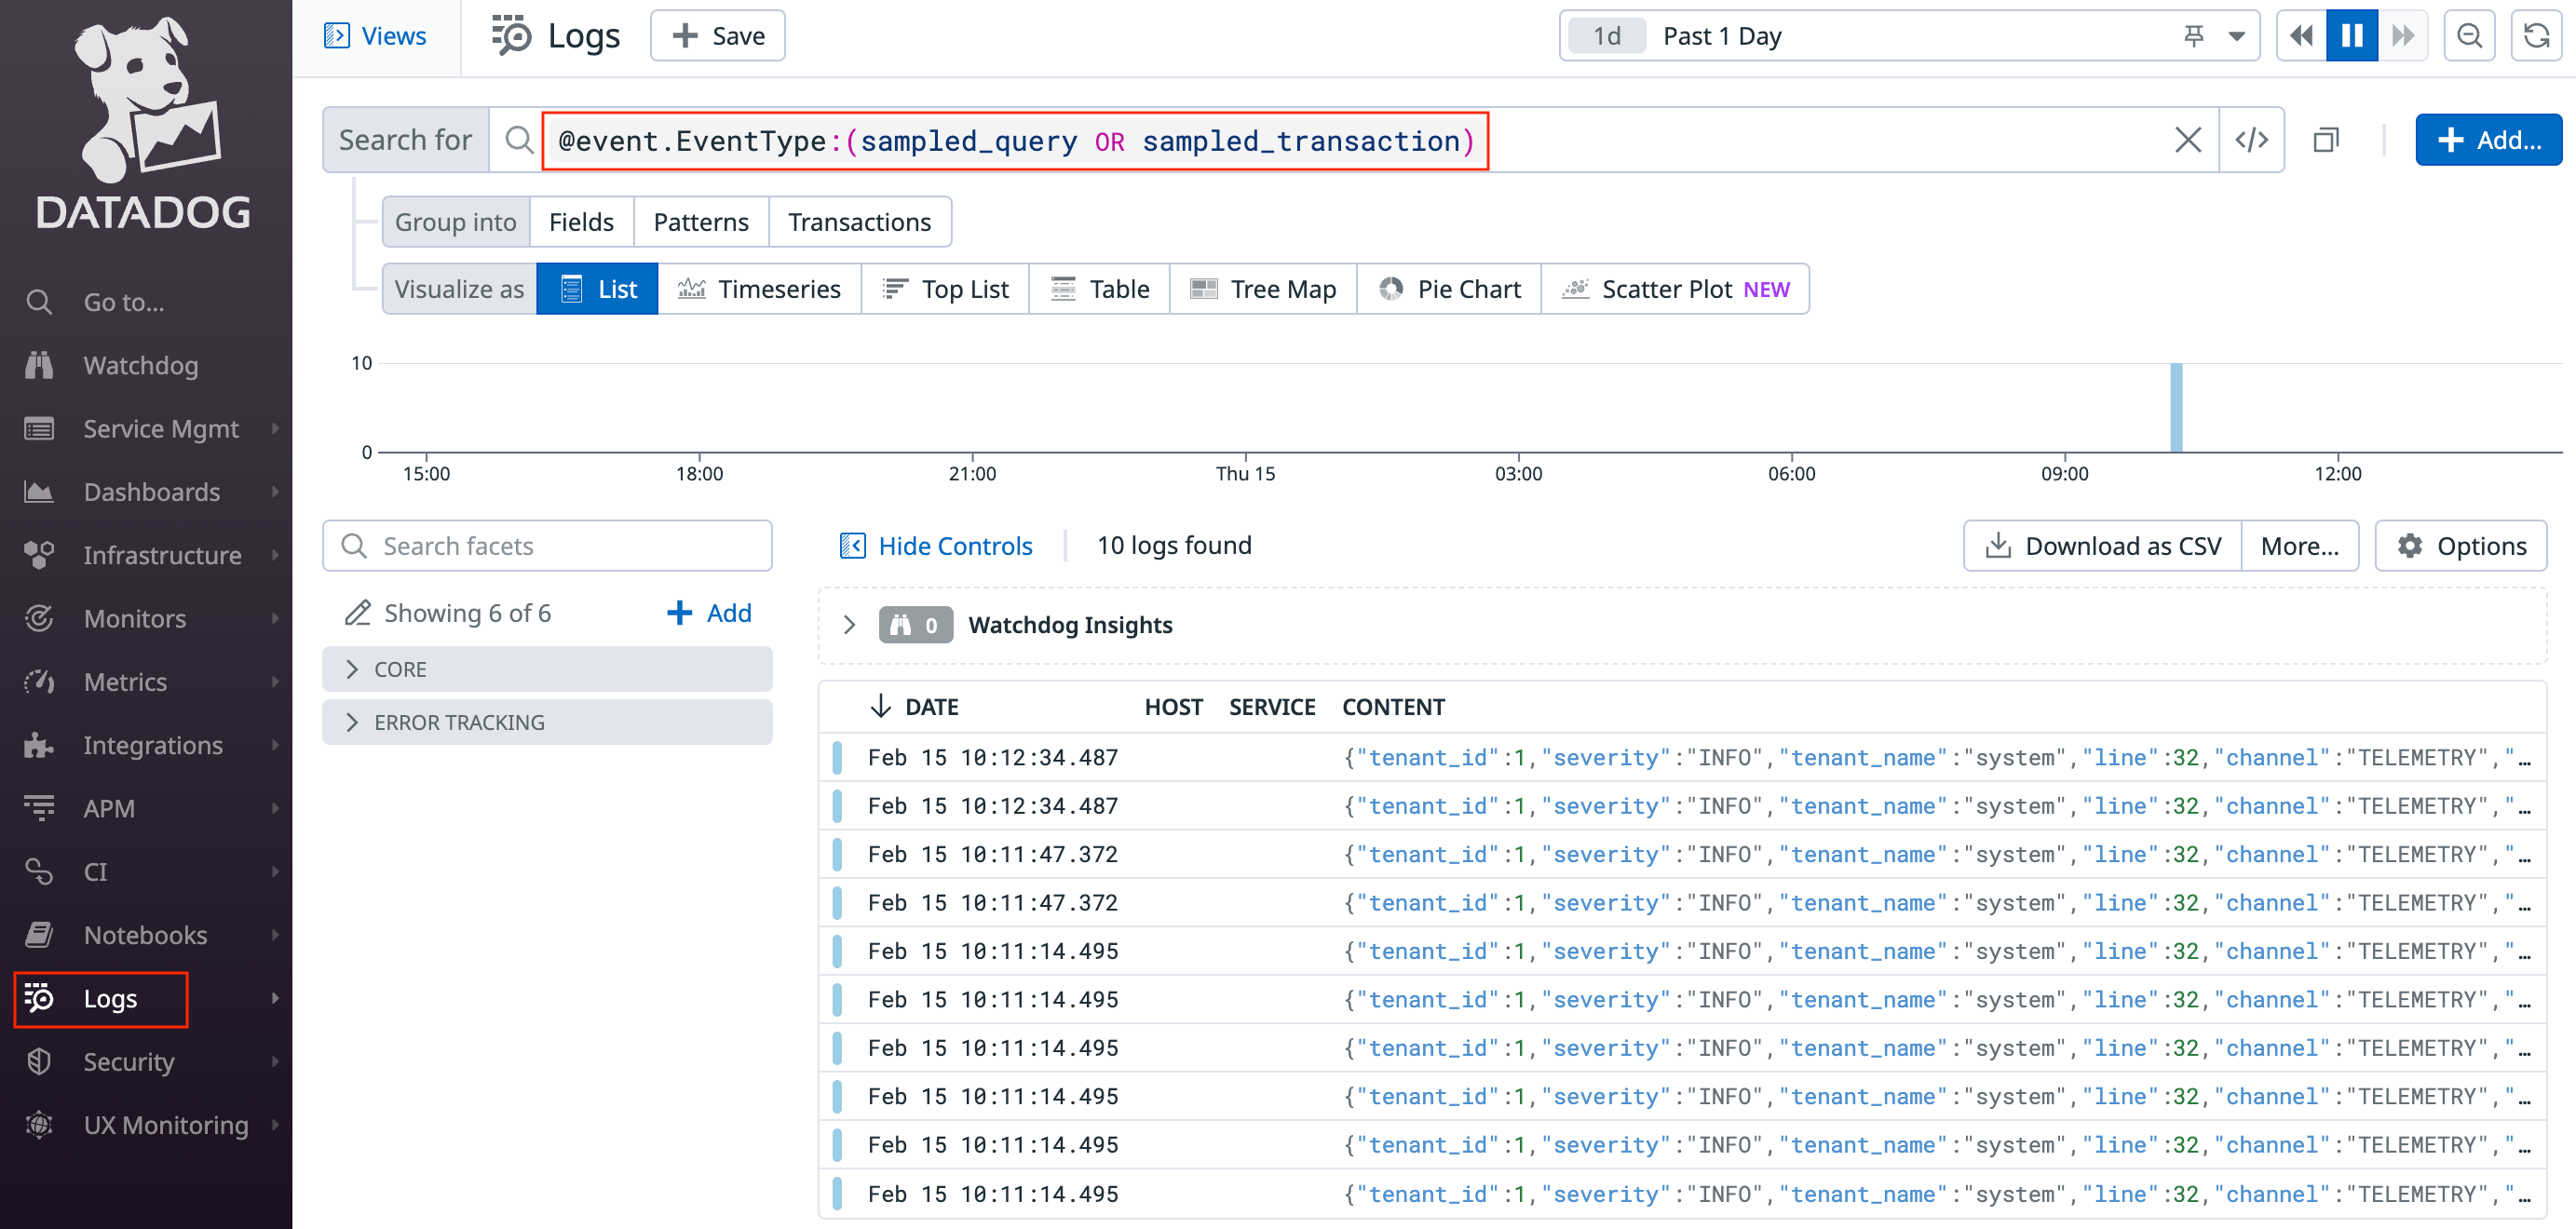
1. Navigate to [**Datadog > Logs**](https://app.datadoghq.com/logs).
2. Search for `@event.EventType:(sampled_query OR sampled_transaction)` to see the logs for the query and transaction events that are emitted. For example:
 ## See also
* Notable Event Types
* Configure logs
* Cluster Settings
## See also
* Notable Event Types
* Configure logs
* Cluster Settings