

- For more information about the integration, see the Datadog blog post.
- For more information about using Datadog, see the Datadog documentation.
- If you run into problems with this integration, please file an issue on the Datadog Agent issue tracker.
Before you begin
Before you can follow the steps presented in this tutorial, you must have:- Downloaded and installed the Datadog Agent.
- Started a .
Step 1. Enable CockroachDB integration
To enable the CockroachDB check for your installed Datadog Agent, navigate to the Integrations page and find CockroachDB in the list of available integrations. Hover over the icon and click + Install.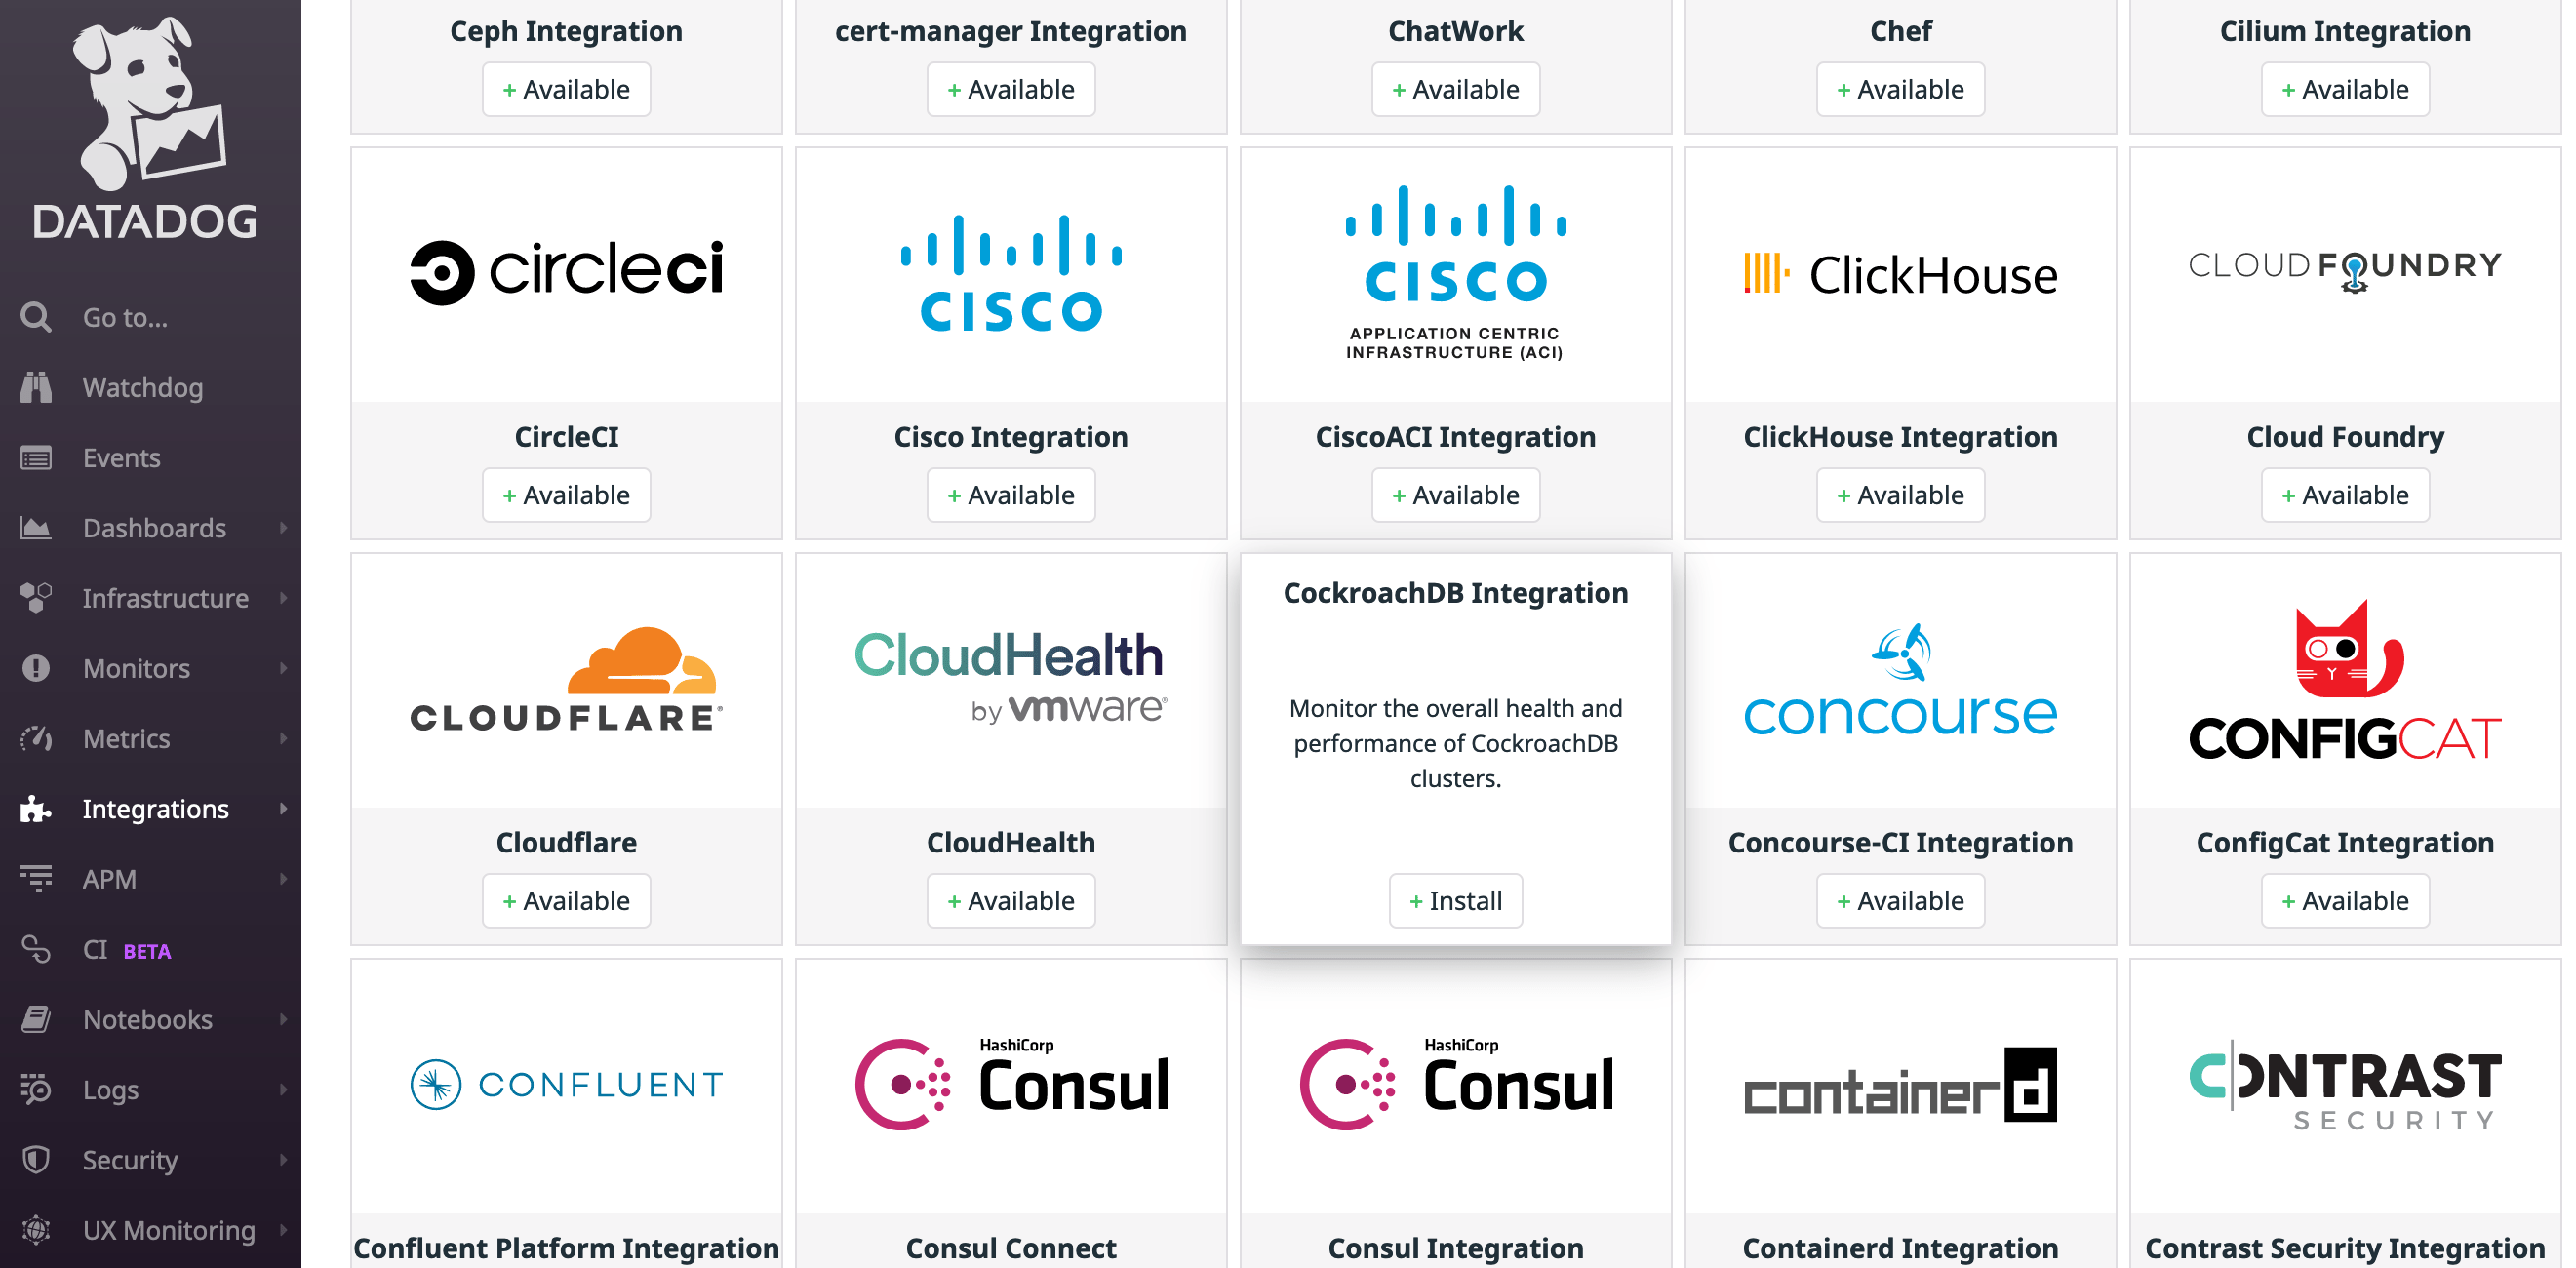
Step 2. Configure Datadog Agent for CockroachDB
Follow the steps in the Datadog documentation to access and edit yourcockroachdb.d/conf.yaml file in your Datadog conf.d/ directory. For all available options, see the sample cockroachdb.d/conf.yaml.
After making the following changes, restart the Datadog Agent to apply them.
Enable metrics collection
Uncomment the following line incockroachdb.d/conf.yaml:
Configure security certificates
Uncomment the lines that begin withtls_private_key and tls_ca_cert. These should specify the full file paths to your CA key and certificate, respectively.
For example, if you used to , the paths would look something like:
Enable log collection
Optionally enable Datadog to collect by adding the following block tocockroachdb.d/conf.yaml:
path value specifies the CockroachDB log file and location.
You can configure both the CockroachDB and .
Step 3. Verify Datadog connection to CockroachDB
To apply your configuration changes, ensure that you have restarted the Datadog Agent. Run the Datadog Agentstatus subcommand for your platform to verify that the CockroachDB integration is properly connected.
Your output should contain a block like this:
Step 4. View CockroachDB dashboards on Datadog
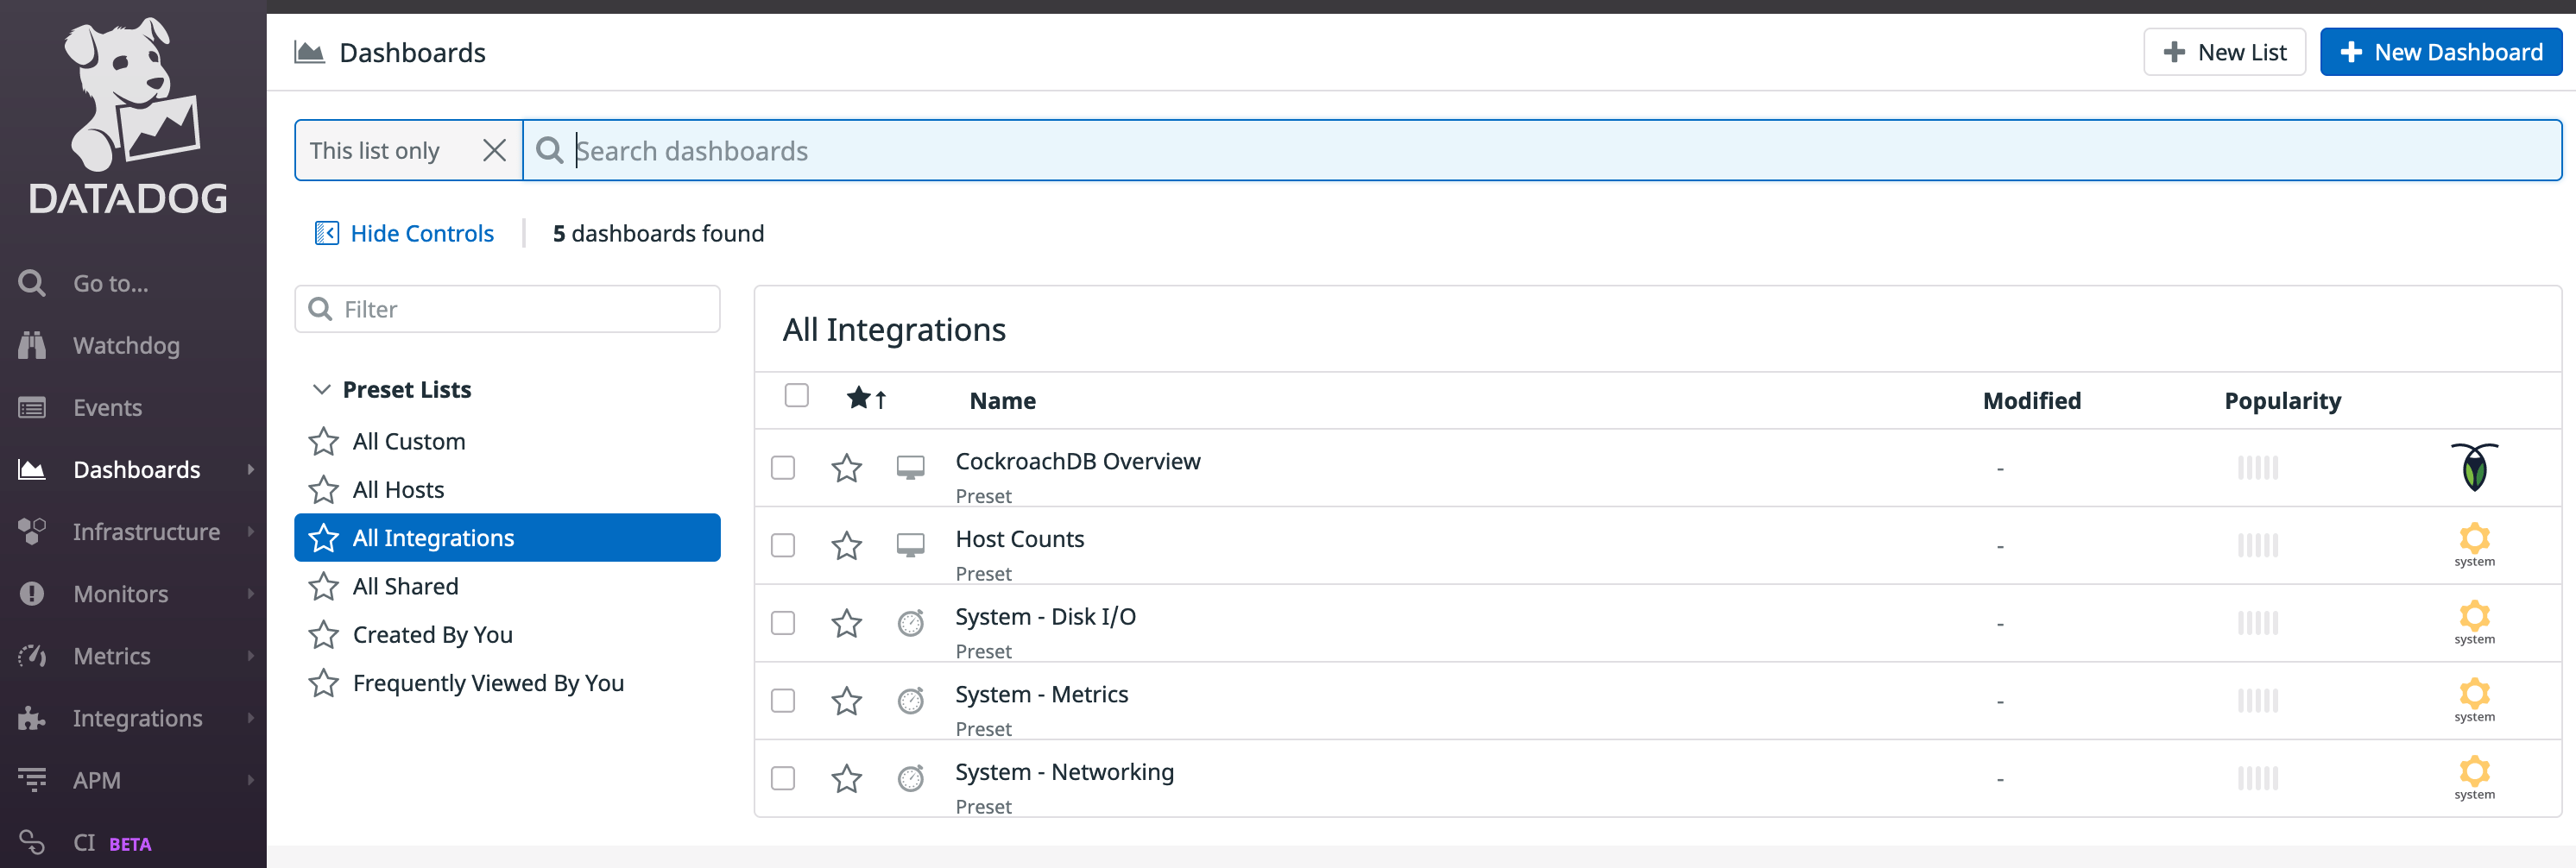
Open your Datadog Dashboard List and click onCockroachDB Overview:
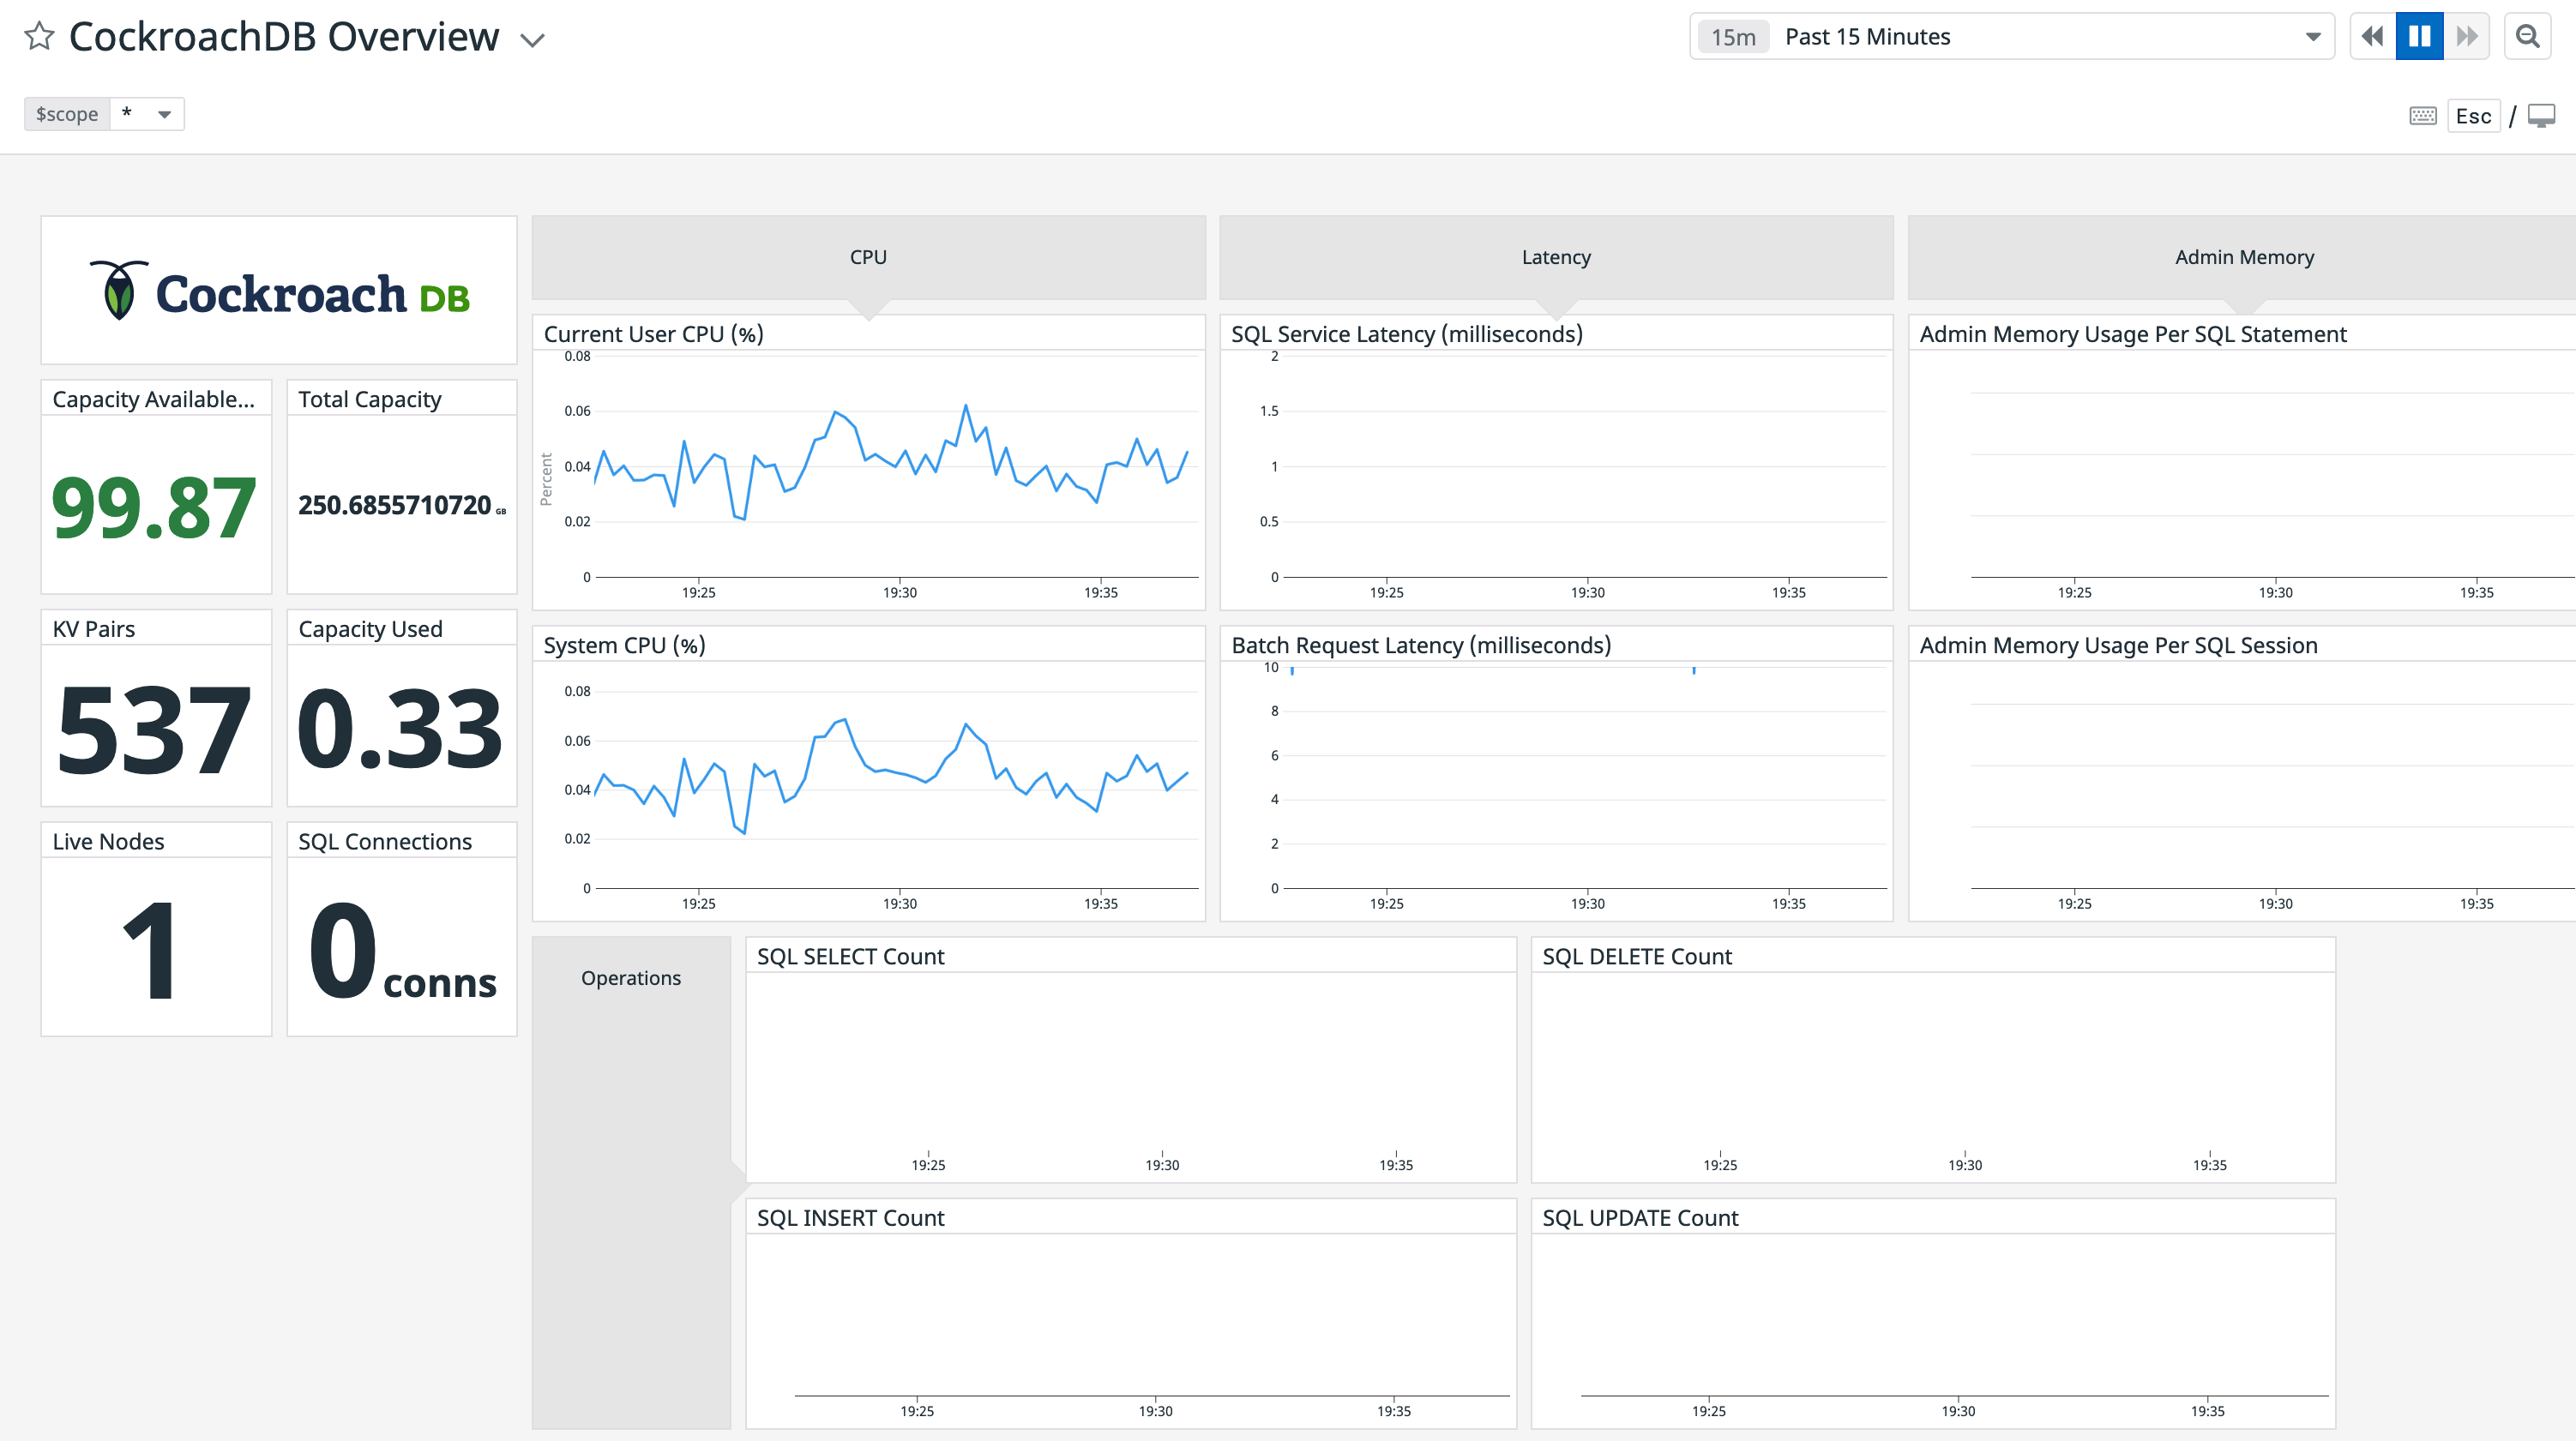
If you wish to customize your CockroachDB dashboard, it’s recommended that you clone the default
CockroachDB Overview dashboard before adding and removing widgets. If you leave the default dashboard intact, Datadog will update it when new versions of the integration’s dashboard are released.Step 5. Run a sample workload
To test the dashboard functionality, use to run a sample workload on the cluster. Initialize the workload for MovR, a fictional vehicle-sharing company: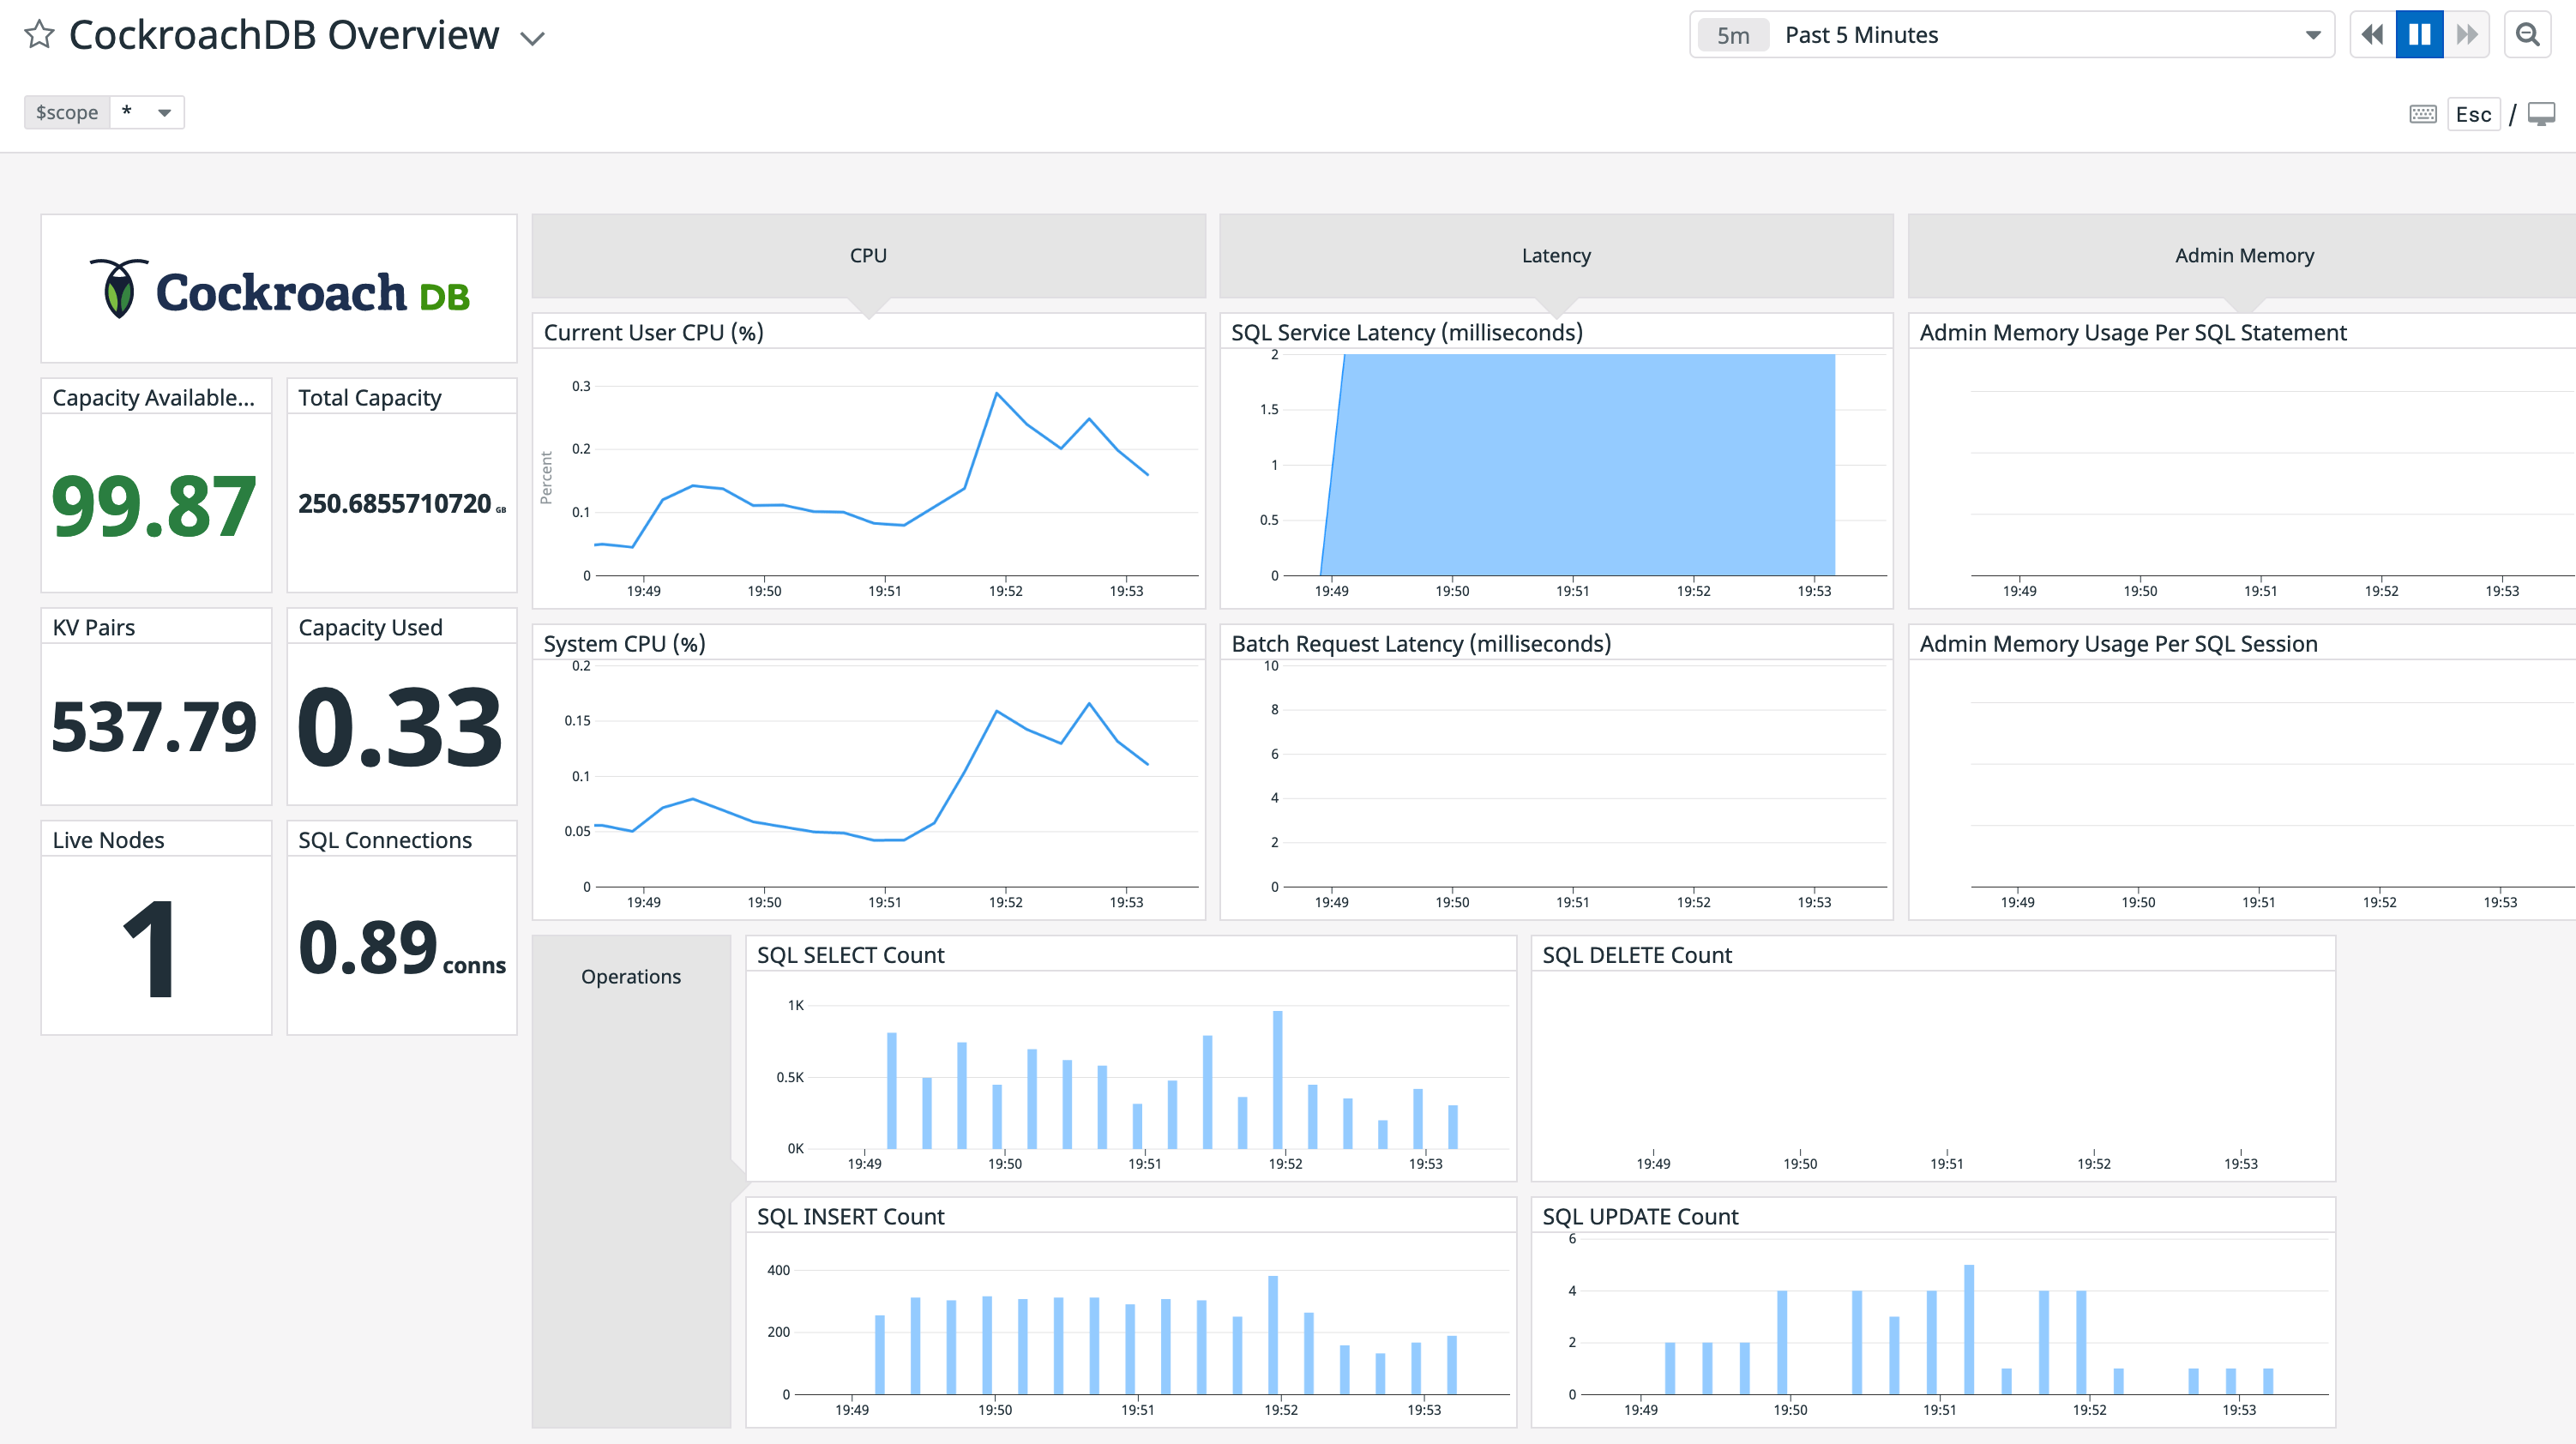
Step 6. Add monitoring and alerting
Follow the steps in the Datadog documentation to create a new Monitor. Select Threshold Alert as the detection method. You can use this option to configure an alert that is sent when a supported metric reaches a given threshold. For descriptions of some useful CockroachDB alerts, see . The example alert below will trigger when :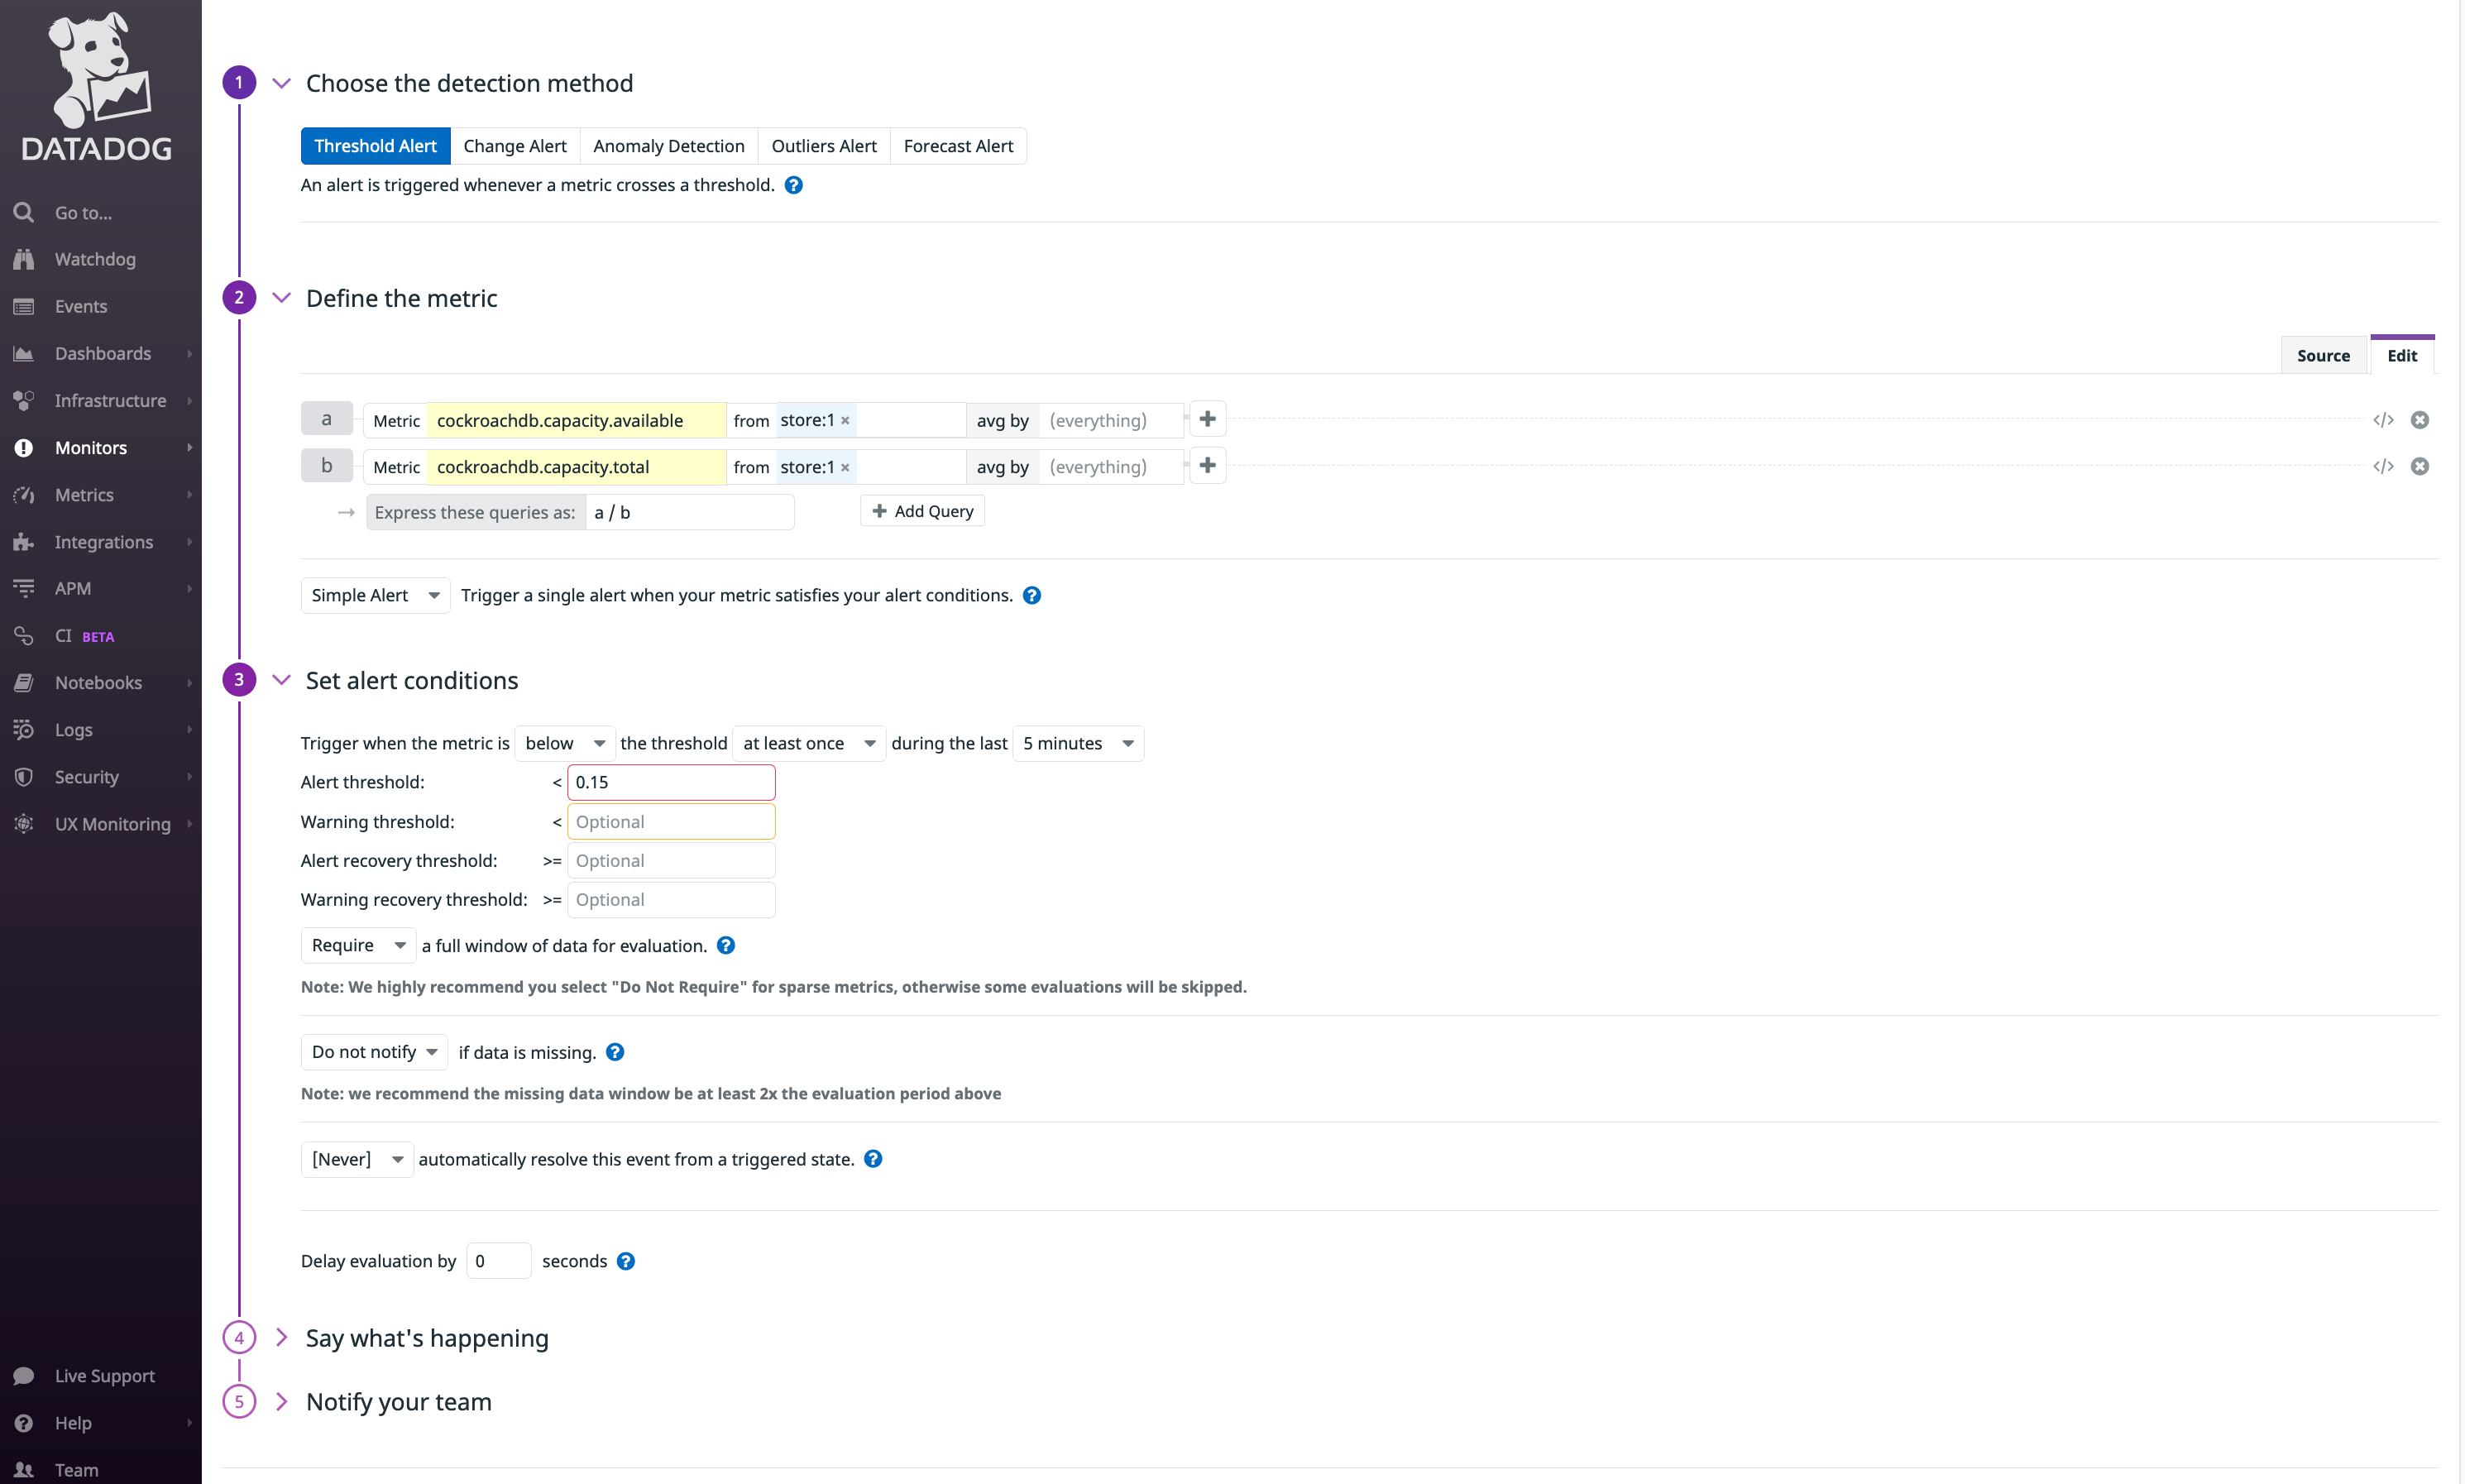
cockroachdb.capacity.availableis divided bycockroachdb.capacity.totalto determine the fraction of available capacity on the node’s (the directory on each node where CockroachDB reads and writes its data).- The alert threshold is set to
0.15.

Known limitations
- The integration of your CockroachDB self-hosted cluster with Datadog only supports displaying cluster-wide averages of reported metrics. Filtering by a specific node is unsupported.