> ## Documentation Index
> Fetch the complete documentation index at: https://cockroachlabs.mintlify.site/llms.txt
> Use this file to discover all available pages before exploring further.
# EXPLAIN
export const InternalLink = ({version, path = "", children, ...props}) => {
let detectedVersion = version || "stable";
if (typeof window !== 'undefined' && !version) {
const match = window.location.pathname.match(/\/docs\/([^/]+)/);
if (match) {
detectedVersion = match[1];
}
}
const normalizedPath = path.startsWith("/") ? path.slice(1) : path;
return
{children}
;
};
The `EXPLAIN` statement returns CockroachDB's statement plan for a preparable statement. You can use this information to optimize the query.
To execute a statement and return a physical statement plan with execution statistics, use `EXPLAIN ANALYZE`.
## Query optimization
Using `EXPLAIN` output, you can optimize your queries as follows:
* Restructure queries to require fewer levels of processing. Queries with fewer levels execute more quickly.
* Avoid scanning an entire table, which is the slowest way to access data. Create indexes that contain at least one of the columns that the query is filtering in its `WHERE` clause.
You can find out if your queries are performing entire table scans by using `EXPLAIN` to see which:
* Indexes the query uses; shown as the value of the `table` property.
* Key values in the index are being scanned; shown as the value of the `spans` property.
You can also see the estimated number of rows that a scan will perform in the `estimated row count` property.
For more information about indexing and table scans, see [Find the Indexes and Key Ranges a Query Uses](#find-the-indexes-and-key-ranges-a-query-uses).
## Synopsis
 ## Required privileges
The user requires the appropriate privileges for the statement being explained.
## Parameters
| Parameter | Description |
| ----------------- | -------------------------------------------------------------------------------------------------------------------------------------------------------------------------------------- |
| `VERBOSE` | Show as much information as possible about the statement plan. See [`VERBOSE` option](#verbose-option). |
| `TYPES` | Include the intermediate data types CockroachDB chooses to evaluate intermediate SQL expressions. See [`TYPES` option](#types-option). |
| `OPT` | Display the statement plan tree generated by the cost-based optimizer. See [`OPT` option](#opt-option). |
| `ENV` | Include all details used by the optimizer, including statistics. See [`ENV` suboption](#opt-env-option). |
| `MEMO` | Print a representation of the optimizer memo with the best plan. See [`MEMO` suboption](#opt-memo-option). |
| `REDACT` | Redact constants, literal values, parameter values, and personally identifiable information (PII) from the output. See [`REDACT` option](#redact-option). |
| `VEC` | Show detailed information about the vectorized execution plan for a query. See [`VEC` option](#vec-option). |
| `DISTSQL` | Generate a URL to a distributed SQL physical statement plan diagram. See [`DISTSQL` option](#distsql-option). |
| `preparable_stmt` | The statement you want details about. All preparable statements are explainable. |
## Success responses
A successful `EXPLAIN` statement returns a table with the following details in the `info` column:
| Detail | Description |
| ----------------------------------------------------------------- | ------------------------------------------------------------------------------------------------------------------------------------------------------------------------------------------------------------------------------------------------------------------------------------------------------------------------------------------------------------------------- |
| [Global properties](#global-properties) | The properties and statistics that apply to the entire statement plan. |
| [Statement plan tree properties](#statement-plan-tree-properties) | A tree representation of the hierarchy of the statement plan. |
| Node details | The properties, columns, and ordering details for the current statement plan node in the tree. |
| `index recommendations` | Number of index recommendations followed by a list of index actions and SQL statements to perform the actions. |
| `Time` | The time details for the query. The total time is the planning and execution time of the query. The execution time is the time it took for the final statement plan to complete. The network time is the amount of time it took to distribute the query across the relevant nodes in the cluster. Some queries do not need to be distributed, so the network time is 0ms. |
### Global properties
| Property | Description |
| -------------- | ----------------------------------------------------------------------------------------------------------------------------------------------------------------------------------------------------------------------------------------------------------------------------------------------------------------------------------------------------------------------------------------------------------------------------- |
| `distribution` | Whether the statement was distributed or local. If `distribution` is `full`, execution of the statement is performed by multiple nodes in parallel, then the results are returned by the gateway node. If `local`, the execution plan is performed only on the gateway node. Even if the execution plan is `local`, row data may be fetched from remote nodes, but the processing of the data is performed by the local node. |
| `vectorized` | Whether the vectorized execution engine was used in this statement. |
### Statement plan tree properties
| Property | Description |
| --------------------- | ---------------------------------------------------------------------------------------------------------------------------------------------------------------------------------------------------------------------------------------------------------------------------------------------------------------------------------------------------------------------------------------------------------------------------------------------------------------------------------------------------------------------- |
| `processor` | Each processor in the statement plan hierarchy has a node with details about that phase of the statement. For example, a statement with a `GROUP BY` clause has a `group` processor with details about the cluster nodes, rows, and operations related to the `GROUP BY` operation. |
| `estimated row count` | The estimated number of rows affected by this processor according to the statement planner, the percentage of the table the query spans, and when the statistics for the table were last collected. |
| `table` | The table and index used in a scan operation in a statement, in the form `{table name}@{index name}`. |
| `spans` | The interval of the key space read by the processor. `FULL SCAN` indicates that the table is scanned on all key ranges of the index (also known as a "full table scan" or "unlimited full scan"). `FULL SCAN (SOFT LIMIT)` indicates that a full table scan can be performed, but will halt early once enough rows have been scanned. `LIMITED SCAN` indicates that the table will be scanned on a subset of key ranges of the index. `[/1 - /1]` indicates that only the key with value `1` is read by the processor. |
## Examples
The following examples use the `movr` example dataset.
Start the MovR database on a 3-node CockroachDB demo cluster with a larger data set.
```shell theme={"theme":{"light":"catppuccin-mocha","dark":"catppuccin-mocha"}}
cockroach demo movr --num-histories 250000 --num-promo-codes 250000 --num-rides 125000 --num-users 12500 --num-vehicles 3750 --nodes 3
```
### Default statement plans
By default, `EXPLAIN` includes the least detail about the statement plan but can be useful to find out which indexes and index key ranges are used by a query. For example:
```sql theme={"theme":{"light":"catppuccin-mocha","dark":"catppuccin-mocha"}}
EXPLAIN SELECT * FROM rides WHERE revenue > 90 ORDER BY revenue ASC;
```
```
info
---------------------------------------------------------------------------------------------------------------------------------------------------
distribution: full
vectorized: true
• sort
│ estimated row count: 12,385
│ order: +revenue
│
└── • filter
│ estimated row count: 12,385
│ filter: revenue > 90
│
└── • scan
estimated row count: 125,000 (100% of the table; stats collected 19 minutes ago)
table: rides@rides_pkey
spans: FULL SCAN
index recommendations: 1
1. type: index creation
SQL command: CREATE INDEX ON rides (revenue) STORING (vehicle_city, rider_id, vehicle_id, start_address, end_address, start_time, end_time);
(19 rows)
Time: 2ms total (execution 2ms / network 0ms)
```
The output shows the tree structure of the statement plan, in this case a `sort`, a `filter`, and a `scan`.
The output also describes a set of properties, some global to the query, some specific to an operation listed in the true structure (in this case, `sort`, `filter`, or `scan`), and an index recommendation:
* `distribution`:`full`
The planner chose a distributed execution plan, where execution of the query is performed by multiple nodes in parallel, then the results are returned by the gateway node. An execution plan with `full` distribution doesn't process on all nodes in the cluster. It is executed simultaneously on multiple nodes. An execution plan with `local` distribution is performed only on the gateway node. Even if the execution plan is `local`, row data may be fetched from remote nodes, but the processing of the data is performed by the local node.
* `vectorized`:`true`
The plan will be executed with the vectorized execution engine.
* `order`:`+revenue`
The sort will be ordered ascending on the `revenue` column.
* `filter`: `revenue > 90`
The scan filters on the `revenue` column.
* `estimated row count`:`125,000 (100% of the table; stats collected 19 minutes ago)`
The estimated number of rows scanned by the query, in this case, `125,000` rows of data; the percentage of the table the query spans, in this case 100%; and when the statistics for the table were last collected, in this case 19 minutes ago. If you do not see statistics, you can manually generate table statistics with `CREATE STATISTICS` or configure more frequent statistics generation following the steps in Control automatic statistics.
* `table`:`rides@rides_pkey`
The table is scanned on the `rides_pkey` index.
* `spans`:`FULL SCAN`
The table is scanned on all key ranges of the `rides_pkey` index (also known as a "full table scan" or "unlimited full scan"). For more information on indexes and key ranges, see the following [example](#find-the-indexes-and-key-ranges-a-query-uses).
* `index recommendations: 1`
The number of index recommendations, followed by the recommendation and statement. The recommendation to create an index on the `rides` table and store the `vehicle_city`, `rider_id`, `vehicle_id`, `start_address`, `end_address`, `start_time`, and `end_time` columns will eliminate the full scan of the `rides` table.
Index recommendations are displayed by default. To disable index recommendations, set the `index_recommendations_enabled` session variable to `false`.
Suppose you create the recommended index:
```
CREATE INDEX ON rides (revenue) STORING (vehicle_city, rider_id, vehicle_id, start_address, end_address, start_time, end_time);
```
The next `EXPLAIN` call demonstrates that the estimated row count is 10% of the table:
```sql theme={"theme":{"light":"catppuccin-mocha","dark":"catppuccin-mocha"}}
EXPLAIN SELECT * FROM rides WHERE revenue > 90 ORDER BY revenue ASC;
```
```
info
------------------------------------------------------------------------------------
distribution: local
vectorized: true
• scan
estimated row count: 12,647 (10% of the table; stats collected 22 seconds ago)
table: rides@rides_revenue_idx
spans: (/90 - ]
(7 rows)
```
If you then limit the number of returned rows:
```sql theme={"theme":{"light":"catppuccin-mocha","dark":"catppuccin-mocha"}}
EXPLAIN SELECT * FROM rides WHERE revenue > 90 ORDER BY revenue ASC limit 10;
```
The limit is reflected both in the estimated row count and a `limit` property:
```
info
-----------------------------------------------------------------------------------
distribution: local
vectorized: true
• scan
estimated row count: 10 (<0.01% of the table; stats collected 32 seconds ago)
table: rides@rides_revenue_idx
spans: (/90 - ]
limit: 10
(8 rows)
```
### Join queries
If you run `EXPLAIN` on a join query, the output will display which type of join will be executed. For example, the following `EXPLAIN` output shows that the query will perform a hash join:
```sql theme={"theme":{"light":"catppuccin-mocha","dark":"catppuccin-mocha"}}
EXPLAIN SELECT * FROM rides AS r
JOIN users AS u ON r.rider_id = u.id;
```
```
info
---------------------------------------------------------------------------------------------------------------------------------------------------
distribution: full
vectorized: true
• hash join
│ estimated row count: 124,482
│ equality: (rider_id) = (id)
│
├── • scan
│ estimated row count: 125,000 (100% of the table; stats collected 13 minutes ago)
│ table: rides@rides_pkey
│ spans: FULL SCAN
│
└── • scan
estimated row count: 12,500 (100% of the table; stats collected 14 minutes ago)
table: users@users_pkey
spans: FULL SCAN
index recommendations: 2
1. type: index creation
SQL command: CREATE INDEX ON rides (rider_id) STORING (vehicle_city, vehicle_id, start_address, end_address, start_time, end_time, revenue);
1. type: index creation
SQL command: CREATE INDEX ON users (id) STORING (name, address, credit_card);
(22 rows)
Time: 2ms total (execution 2ms / network 0ms)
```
The following output shows that the query will perform a cross join:
```sql theme={"theme":{"light":"catppuccin-mocha","dark":"catppuccin-mocha"}}
EXPLAIN SELECT * FROM rides AS r
JOIN users AS u ON r.city = 'new york';
```
```
info
-----------------------------------------------------------------------------------------
distribution: full
vectorized: true
• cross join
│ estimated row count: 178,283,221
│
├── • scan
│ estimated row count: 14,263 (11% of the table; stats collected 14 minutes ago)
│ table: rides@rides_pkey
│ spans: [/'new york' - /'new york']
│
└── • scan
estimated row count: 12,500 (100% of the table; stats collected 15 minutes ago)
table: users@users_pkey
spans: FULL SCAN
(15 rows)
Time: 2ms total (execution 2ms / network 0ms)
```
### Insert queries
`EXPLAIN` output for `INSERT` queries is similar to the output for standard `SELECT` queries. For example:
```sql theme={"theme":{"light":"catppuccin-mocha","dark":"catppuccin-mocha"}}
EXPLAIN INSERT INTO users(id, city, name) VALUES ('c28f5c28-f5c2-4000-8000-000000000026', 'new york', 'Petee');
```
```
info
-------------------------------------------------------
distribution: local
vectorized: true
• insert fast path
into: users(id, city, name, address, credit_card)
auto commit
size: 5 columns, 1 row
(7 rows)
Time: 1ms total (execution 1ms / network 0ms)
```
The output for this `INSERT` lists the primary operation (in this case, `insert`), and the table and columns affected by the operation in the `into` field (in this case, the `id`, `city`, `name`, `address`, and `credit_card` columns of the `users` table). The output also includes the size of the `INSERT` in the `size` field (in this case, 5 columns in a single row).
For more complex types of `INSERT` queries, `EXPLAIN` output can include more information. For example, suppose that you create a `UNIQUE` index on the `users` table:
```sql theme={"theme":{"light":"catppuccin-mocha","dark":"catppuccin-mocha"}}
CREATE UNIQUE INDEX ON users(city, id, name);
```
To display the `EXPLAIN` output for an `INSERT ... ON CONFLICT` statement, which inserts some data that might conflict with the `UNIQUE` constraint imposed on the `name`, `city`, and `id` columns, run:
```sql theme={"theme":{"light":"catppuccin-mocha","dark":"catppuccin-mocha"}}
EXPLAIN INSERT INTO users(id, city, name) VALUES ('c28f5c28-f5c2-4000-8000-000000000026', 'new york', 'Petee') ON CONFLICT DO NOTHING;
```
```
info
----------------------------------------------------------------------------------------------------------------------------------
distribution: local
vectorized: true
• insert
│ into: users(id, city, name, address, credit_card)
│ auto commit
│ arbiter indexes: users_pkey, users_city_id_name_key
│
└── • lookup join (anti)
│ estimated row count: 0
│ table: users@users_city_id_name_key
│ equality: (city_cast, column1, name_cast) = (city,id,name)
│ equality cols are key
│
└── • cross join (anti)
│ estimated row count: 0
│
├── • values
│ size: 4 columns, 1 row
│
└── • scan
estimated row count: 1 (<0.01% of the table; stats collected 18 minutes ago)
table: users@users_city_id_name_key
spans: [/'new york'/'c28f5c28-f5c2-4000-8000-000000000026' - /'new york'/'c28f5c28-f5c2-4000-8000-000000000026']
(24 rows)
Time: 3ms total (execution 3ms / network 0ms)
```
Because the `INSERT` includes an `ON CONFLICT` clause, the query requires more than a simple `insert` operation. CockroachDB must check the provided values against the values in the database, to ensure that the `UNIQUE` constraint on `name`, `city`, and `id` is not violated. The output also lists the indexes available to detect conflicts (the `arbiter indexes`), including the `users_city_id_name_key` index.
### Alter queries
If you alter a table to split a range as described in Split a table, the `EXPLAIN` command returns the target table and index names and a `NULL` expiry timestamp:
```sql theme={"theme":{"light":"catppuccin-mocha","dark":"catppuccin-mocha"}}
EXPLAIN ALTER TABLE users SPLIT AT VALUES ('chicago'), ('new york'), ('seattle');
```
```
info
----------------------------------
distribution: local
vectorized: true
• split
│ index: users@users_pkey
│ expiry: CAST(NULL AS STRING)
│
└── • values
size: 1 column, 3 rows
(9 rows)
```
If you alter a table to split a range as described in Set the expiration on a split enforcement, the `EXPLAIN` command returns the target table and index names and the expiry timestamp:
```sql theme={"theme":{"light":"catppuccin-mocha","dark":"catppuccin-mocha"}}
EXPLAIN ALTER TABLE vehicles SPLIT AT VALUES ('chicago'), ('new york'), ('seattle') WITH EXPIRATION '2022-08-10 23:30:00+00:00';
```
```
info
-----------------------------------------
distribution: local
vectorized: true
• split
│ index: vehicles@vehicles_pkey
│ expiry: '2022-08-10 23:30:00+00:00'
│
└── • values
size: 1 column, 3 rows
(9 rows)
```
### Options
#### `VERBOSE` option
The `VERBOSE` option includes:
* SQL expressions that are involved in each processing stage, providing more granular detail about which portion of your query is represented at each level.
* Detail about which columns are being used by each level, as well as properties of the result set on that level.
```sql theme={"theme":{"light":"catppuccin-mocha","dark":"catppuccin-mocha"}}
EXPLAIN (VERBOSE) SELECT * FROM rides AS r
JOIN users AS u ON r.rider_id = u.id
WHERE r.city = 'new york'
ORDER BY r.revenue ASC;
```
```
info
------------------------------------------------------------------------------------------------------------------------------------------------------------------
distribution: full
vectorized: true
• sort
│ columns: (id, city, vehicle_city, rider_id, vehicle_id, start_address, end_address, start_time, end_time, revenue, id, city, name, address, credit_card)
│ ordering: +revenue
│ estimated row count: 14,087
│ order: +revenue
│
└── • hash join (inner)
│ columns: (id, city, vehicle_city, rider_id, vehicle_id, start_address, end_address, start_time, end_time, revenue, id, city, name, address, credit_card)
│ estimated row count: 14,087
│ equality: (rider_id) = (id)
│
├── • scan
│ columns: (id, city, vehicle_city, rider_id, vehicle_id, start_address, end_address, start_time, end_time, revenue)
│ estimated row count: 14,087 (11% of the table; stats collected 29 minutes ago)
│ table: rides@rides_pkey
│ spans: /"new york"-/"new york"/PrefixEnd
│
└── • scan
columns: (id, city, name, address, credit_card)
estimated row count: 12,500 (100% of the table; stats collected 42 seconds ago)
table: users@users_pkey
spans: FULL SCAN
(25 rows)
Time: 2ms total (execution 2ms / network 0ms)
```
#### `TYPES` option
The `TYPES` option includes:
* The types of the values used in the statement plan.
* The SQL expressions that were involved in each processing stage, and the columns used by each level.
* All information that is included with the [`VERBOSE`](#verbose-option) option.
```sql theme={"theme":{"light":"catppuccin-mocha","dark":"catppuccin-mocha"}}
EXPLAIN (TYPES) SELECT * FROM rides WHERE revenue > 90 ORDER BY revenue ASC;
```
```
info
----------------------------------------------------------------------------------------------------
distribution: full
vectorized: true
• sort
│ columns: (id uuid, city varchar, vehicle_city varchar, rider_id uuid, vehicle_id uuid, start_address varchar, end_address varchar, start_time timestamp, end_time timestamp, revenue decimal)
│ ordering: +revenue
│ estimated row count: 12,317
│ order: +revenue
│
└── • filter
│ columns: (id uuid, city varchar, vehicle_city varchar, rider_id uuid, vehicle_id uuid, start_address varchar, end_address varchar, start_time timestamp, end_time timestamp, revenue decimal)
│ estimated row count: 12,317
│ filter: ((revenue)[decimal] > (90)[decimal])[bool]
│
└── • scan
columns: (id uuid, city varchar, vehicle_city varchar, rider_id uuid, vehicle_id uuid, start_address varchar, end_address varchar, start_time timestamp, end_time timestamp, revenue decimal)
estimated row count: 125,000 (100% of the table; stats collected 29 minutes ago)
table: rides@rides_pkey
spans: FULL SCAN
(19 rows)
Time: 1ms total (execution 1ms / network 0ms)
```
#### `REDACT` option
The `REDACT` option causes constants, literal values, parameter values, and personally identifiable information (PII) to be redacted as `‹×›` in the physical statement plan.
You can also use `REDACT` with the [`OPT`](#opt-option) option and its suboptions.
```sql theme={"theme":{"light":"catppuccin-mocha","dark":"catppuccin-mocha"}}
EXPLAIN (REDACT) SELECT * FROM rides WHERE revenue > 90 ORDER BY revenue ASC;
```
```
info
---------------------------------------------------------------------------------------------------------------------------------------------------------------
distribution: local
vectorized: true
• sort
│ estimated row count: 12,156
│ order: +revenue
│
└── • filter
│ estimated row count: 12,156
│ filter: revenue > ‹×›
│
└── • scan
estimated row count: 125,000 (100% of the table; stats collected 22 hours ago)
table: rides@rides_pkey
spans: FULL SCAN
index recommendations: 1
1. type: index creation
SQL command: CREATE INDEX ON movr.public.rides (revenue) STORING (vehicle_city, rider_id, vehicle_id, start_address, end_address, start_time, end_time);
(19 rows)
Time: 5ms total (execution 5ms / network 0ms)
```
In the preceding output, the `revenue` comparison value is redacted as `‹×›`.
#### `OPT` option
To display the statement plan tree generated by the cost-based optimizer, use the `OPT` option . For example:
```sql theme={"theme":{"light":"catppuccin-mocha","dark":"catppuccin-mocha"}}
EXPLAIN (OPT) SELECT * FROM rides WHERE revenue > 90 ORDER BY revenue ASC;
```
```
info
-------------------------------
sort
└── select
├── scan rides
└── filters
└── revenue > 90
(5 rows)
Time: 1ms total (execution 1ms / network 0ms)
```
`OPT` has five suboptions: [`VERBOSE`](#opt-verbose-option), [`TYPES`](#opt-types-option), [`ENV`](#opt-env-option), [`MEMO`](#opt-memo-option), [`REDACT`](#opt-redact-option).
##### `OPT, VERBOSE` option
To include cost details used by the optimizer in planning the query, use the `OPT, VERBOSE` option:
```sql theme={"theme":{"light":"catppuccin-mocha","dark":"catppuccin-mocha"}}
EXPLAIN (OPT, VERBOSE) SELECT * FROM rides WHERE revenue > 90 ORDER BY revenue ASC;
```
```
info
---------------------------------------------------------------------------------------------------- ...
sort
├── columns: id:1 city:2 vehicle_city:3 rider_id:4 vehicle_id:5 start_address:6 end_address:7 start_time:8 end_time:9 revenue:10
├── immutable
├── stats: [rows=12316.644, distinct(10)=9.90909091, null(10)=0]
│ histogram(10)= 0 0 11130 1187
│ <--- 90 ------- 99
├── cost: 156091.288
├── key: (1,2)
├── fd: (1,2)-->(3-10)
├── ordering: +10
├── prune: (1-9)
├── interesting orderings: (+2,+1) (+2,+4,+1) (+3,+5,+2,+1) (+8,+2,+1) (+4,+2,+1)
└── select
├── columns: id:1 city:2 vehicle_city:3 rider_id:4 vehicle_id:5 start_address:6 end_address:7 start_time:8 end_time:9 revenue:10
├── immutable
├── stats: [rows=12316.644, distinct(10)=9.90909091, null(10)=0]
│ histogram(10)= 0 0 11130 1187
│ <--- 90 ------- 99
├── cost: 151266.03
├── key: (1,2)
├── fd: (1,2)-->(3-10)
├── prune: (1-9)
├── interesting orderings: (+2,+1) (+2,+4,+1) (+3,+5,+2,+1) (+8,+2,+1) (+4,+2,+1)
├── scan rides
│ ├── columns: id:1 city:2 vehicle_city:3 rider_id:4 vehicle_id:5 start_address:6 end_address:7 start_time:8 end_time:9 revenue:10
│ ├── stats: [rows=125000, distinct(1)=125000, null(1)=0, distinct(2)=9, null(2)=0, distinct(10)=100, null(10)=0]
│ │ histogram(1)= 0 12 612 12 612 12 612
<--- '00064a9c-dc44-4915-8000-00000000000c' ----- '0162f166-e008-49b0-8000-0000000002a5' ----- '02834d26-fa3f-4ca0-8000-0000000004cb' ----- '03c85c24-c404-4720-
│ │ histogram(2)= 0 14512 0 13637 0 14512 0 14087 0 13837 0 13737 0 13550 0 13412 0 13712
│ │ <--- 'amsterdam' --- 'boston' --- 'los angeles' --- 'new york' --- 'paris' --- 'rome' --- 'san francisco' --- 'seattle' --- 'washington dc'
│ │ histogram(10)= 0 1387 1.2242e+05 1187
│ │ <--- 0 ------------- 99
│ ├── cost: 150016.01
│ ├── key: (1,2)
│ ├── fd: (1,2)-->(3-10)
│ ├── prune: (1-10)
│ └── interesting orderings: (+2,+1) (+2,+4,+1) (+3,+5,+2,+1) (+8,+2,+1) (+4,+2,+1)
└── filters
└── revenue:10 > 90 [outer=(10), immutable, constraints=(/10: (/90 - ]; tight)]
(39 rows)
Time: 4ms total (execution 3ms / network 1ms)
```
##### `OPT, TYPES` option
To include cost and type details, use the `OPT, TYPES` option:
```sql theme={"theme":{"light":"catppuccin-mocha","dark":"catppuccin-mocha"}}
EXPLAIN (OPT, TYPES) SELECT * FROM rides WHERE revenue > 90 ORDER BY revenue ASC;
```
```
info
---------------------------------------------------------------------------------------------------- ...
sort
├── columns: id:1(uuid!null) city:2(varchar!null) vehicle_city:3(varchar) rider_id:4(uuid) vehicle_id:5(uuid) start_address:6(varchar) end_address:7(varchar) start_time:8(timestamp) end_time:9(timestamp) revenue:10(decimal!null)
├── immutable
├── stats: [rows=12316.644, distinct(10)=9.90909091, null(10)=0]
│ histogram(10)= 0 0 11130 1187
│ <--- 90 ------- 99
├── cost: 156091.288
├── key: (1,2)
├── fd: (1,2)-->(3-10)
├── ordering: +10
├── prune: (1-9)
├── interesting orderings: (+2,+1) (+2,+4,+1) (+3,+5,+2,+1) (+8,+2,+1) (+4,+2,+1)
└── select
├── columns: id:1(uuid!null) city:2(varchar!null) vehicle_city:3(varchar) rider_id:4(uuid) vehicle_id:5(uuid) start_address:6(varchar) end_address:7(varchar) start_time:8(timestamp) end_time:9(timestamp) revenue:10(decimal!null)
├── immutable
├── stats: [rows=12316.644, distinct(10)=9.90909091, null(10)=0]
│ histogram(10)= 0 0 11130 1187
│ <--- 90 ------- 99
├── cost: 151266.03
├── key: (1,2)
├── fd: (1,2)-->(3-10)
├── prune: (1-9)
├── interesting orderings: (+2,+1) (+2,+4,+1) (+3,+5,+2,+1) (+8,+2,+1) (+4,+2,+1)
├── scan rides
│ ├── columns: id:1(uuid!null) city:2(varchar!null) vehicle_city:3(varchar) rider_id:4(uuid) vehicle_id:5(uuid) start_address:6(varchar) end_address:7(varchar) start_time:8(timestamp) end_time:9(timestamp) revenue:10(decimal)
│ ├── stats: [rows=125000, distinct(1)=125000, null(1)=0, distinct(2)=9, null(2)=0, distinct(10)=100, null(10)=0]
│ │ histogram(1)= 0 12 612 12 612 12 612
│ │ <--- '00064a9c-dc44-4915-8000-00000000000c' ----- '0162f166-e008-49b0-8000-0000000002a5' ----- '02834d26-fa3f-4ca0-8000-0000000004cb' ----- '03c85c24-c404-4720-
│ │ histogram(2)= 0 14512 0 13637 0 14512 0 14087 0 13837 0 13737 0 13550 0 13412 0 13712
│ │ <--- 'amsterdam' --- 'boston' --- 'los angeles' --- 'new york' --- 'paris' --- 'rome' --- 'san francisco' --- 'seattle' --- 'washington dc'
│ │ histogram(10)= 0 1387 1.2242e+05 1187
│ │ <--- 0 ------------- 99
│ ├── cost: 150016.01
│ ├── key: (1,2)
│ ├── fd: (1,2)-->(3-10)
│ ├── prune: (1-10)
│ └── interesting orderings: (+2,+1) (+2,+4,+1) (+3,+5,+2,+1) (+8,+2,+1) (+4,+2,+1)
└── filters
└── gt [type=bool, outer=(10), immutable, constraints=(/10: (/90 - ]; tight)]
├── variable: revenue:10 [type=decimal]
└── const: 90 [type=decimal]
(41 rows)
Time: 4ms total (execution 3ms / network 1ms)
```
##### `OPT, ENV` option
To include all details used by the optimizer, including statistics, use the `OPT, ENV` option.
```sql theme={"theme":{"light":"catppuccin-mocha","dark":"catppuccin-mocha"}}
EXPLAIN (OPT, ENV) SELECT * FROM rides WHERE revenue > 90 ORDER BY revenue ASC;
```
The output of `EXPLAIN (OPT, ENV)` is a URL with the data encoded in the fragment portion. Encoding the data makes it easier to share debugging information across different systems without encountering formatting issues. Opening the URL shows a page with the decoded data. The data is processed in the local browser session and is never sent out over the network. Keep in mind that if you are using any browser extensions, they may be able to access the data locally.
```
info
----------------------------------------------------------------- ...
https://cockroachdb.github.io/text/decode.html#eJzsm9Fum0gXx6_L ...
(1 row)
Time: 32ms total (execution 32ms / network 0ms)
```
When you open the URL you should see the following output in your browser.
```
-- Version: CockroachDB CCL
-- reorder_joins_limit has the default value: 8
-- enable_zigzag_join has the default value: on
-- optimizer_use_histograms has the default value: on
-- optimizer_use_multicol_stats has the default value: on
-- locality_optimized_partitioned_index_scan has the default value: on
-- distsql has the default value: auto
-- vectorize has the default value: on
CREATE TABLE public.rides (
id UUID NOT NULL,
city VARCHAR NOT NULL,
vehicle_city VARCHAR NULL,
rider_id UUID NULL,
vehicle_id UUID NULL,
start_address VARCHAR NULL,
end_address VARCHAR NULL,
start_time TIMESTAMP NULL,
end_time TIMESTAMP NULL,
revenue DECIMAL(10,2) NULL,
CONSTRAINT "primary" PRIMARY KEY (city ASC, id ASC),
CONSTRAINT fk_city_ref_users FOREIGN KEY (city, rider_id) REFERENCES public.users(city, id),
CONSTRAINT fk_vehicle_city_ref_vehicles FOREIGN KEY (vehicle_city, vehicle_id) REFERENCES public.vehicles(city, id),
INDEX rides_auto_index_fk_city_ref_users (city ASC, rider_id ASC),
INDEX rides_auto_index_fk_vehicle_city_ref_vehicles (vehicle_city ASC, vehicle_id ASC),
INDEX rides_start_time_idx (start_time ASC) STORING (rider_id),
INDEX rides_rider_id_idx (rider_id ASC),
FAMILY "primary" (id, city, vehicle_city, rider_id, vehicle_id, start_address, end_address, start_time, end_time, revenue),
CONSTRAINT check_vehicle_city_city CHECK (vehicle_city = city)
);
ALTER TABLE movr.public.rides INJECT STATISTICS '[
{
"columns": [
"city"
],
"created_at": "2021-03-16 17:27:01.301903",
"distinct_count": 9,
"histo_col_type": "STRING",
"name": "__auto__",
"null_count": 0,
"row_count": 125000
},
{
"columns": [
"id"
],
"created_at": "2021-03-16 17:27:01.301903",
"distinct_count": 125617,
"histo_col_type": "UUID",
"name": "__auto__",
"null_count": 0,
"row_count": 125000
},
{
"columns": [
"city",
"id"
],
"created_at": "2021-03-16 17:27:01.301903",
"distinct_count": 124937,
"histo_col_type": "",
"name": "__auto__",
"null_count": 0,
"row_count": 125000
},
...
]';
EXPLAIN (OPT, ENV) SELECT * FROM rides WHERE revenue > 90 ORDER BY revenue ASC;
----
sort
└── select
├── scan rides
└── filters
└── revenue > 90
```
##### `OPT, MEMO` option
The `MEMO` suboption prints a representation of the optimizer memo with the best plan. You can use the `MEMO` flag in combination with other flags. For example, `EXPLAIN (OPT, MEMO, VERBOSE)` prints the memo along with verbose output for the best plan.
```sql theme={"theme":{"light":"catppuccin-mocha","dark":"catppuccin-mocha"}}
EXPLAIN (OPT, MEMO) SELECT * FROM rides WHERE revenue > 90 ORDER BY revenue ASC;
```
```
info
---------------------------------------------------------------------------------------------------- ...
memo (optimized, ~5KB, required=[presentation: info:13])
├── G1: (explain G2 [presentation: id:1,city:2,vehicle_city:3,rider_id:4,vehicle_id:5,start_address:6,end_address:7,start_time:8,end_time:9,revenue:10] [ordering: +10])
│ └── [presentation: info:13]
│ ├── best: (explain G2="[presentation: id:1,city:2,vehicle_city:3,rider_id:4,vehicle_id:5,start_address:6,end_address:7,start_time:8,end_time:9,revenue:10] [ordering: +10]" [presentation: id:1,city:2,vehicle_city:3,rider_id:4,vehicle_id:5,start_address:6,end_address:7,start_time:8,end_time:9,revenue:10] [ordering: +10])
│ └── cost: 2939.68
├── G2: (select G3 G4)
│ ├── [presentation: id:1,city:2,vehicle_city:3,rider_id:4,vehicle_id:5,start_address:6,end_address:7,start_time:8,end_time:9,revenue:10] [ordering: +10]
│ │ ├── best: (sort G2)
│ │ └── cost: 2939.66
│ └── []
│ ├── best: (select G3 G4)
│ └── cost: 2883.30
├── G3: (scan rides,cols=(1-10))
│ ├── [ordering: +10]
│ │ ├── best: (sort G3)
│ │ └── cost: 3551.50
│ └── []
│ ├── best: (scan rides,cols=(1-10))
│ └── cost: 2863.02
├── G4: (filters G5)
├── G5: (gt G6 G7)
├── G6: (variable revenue)
└── G7: (const 90)
sort
└── select
├── scan rides
└── filters
└── revenue > 90
(28 rows)
Time: 2ms total (execution 2ms / network 1ms)
```
##### `OPT, REDACT` option
The `REDACT` suboption causes constants, literal values, parameter values, and personally identifiable information (PII) to be redacted as `‹×›` in the physical statement plan.
You can also use the `REDACT` option in combination with the [`VERBOSE`](#opt-verbose-option), [`TYPES`](#opt-types-option), and [`MEMO`](#opt-memo-option) suboptions.
```sql theme={"theme":{"light":"catppuccin-mocha","dark":"catppuccin-mocha"}}
EXPLAIN (OPT, REDACT) SELECT * FROM rides WHERE revenue > 90 ORDER BY revenue ASC;
```
```
info
-------------------------------------
distribute
└── sort
└── select
├── scan rides
└── filters
└── revenue > ‹×›
(6 rows)
```
In the preceding output, the `revenue` comparison value is redacted as `‹×›`.
#### `VEC` option
To view details about the vectorized execution plan for the query, use the `VEC` option.
```sql theme={"theme":{"light":"catppuccin-mocha","dark":"catppuccin-mocha"}}
EXPLAIN (VEC) SELECT * FROM rides WHERE revenue > 90 ORDER BY revenue ASC;
```
The output shows the different internal functions that will be used to process each batch of column-oriented data.
```
info
------------------------------------------------
│
└ Node 1
└ *colexec.sortOp
└ *colexecsel.selGTDecimalDecimalConstOp
└ *colfetcher.ColBatchScan
(5 rows)
Time: 1ms total (execution 1ms / network 0ms)
```
#### `DISTSQL` option
To view a physical statement plan that provides high level information about how a query will be executed, use the `DISTSQL` option. For more information about distributed SQL queries, see the DistSQL section of our SQL layer architecture.
The generated physical statement plan is encoded into a byte string after the [fragment identifier (`#`)](https://wikipedia.org/wiki/Fragment_identifier) in the generated URL. The fragment is not sent to the web server; instead, the browser waits for the web server to return a `decode.html` resource, and then JavaScript on the web page decodes the fragment into a physical statement plan diagram. The statement plan is, therefore, not logged by a server external to the CockroachDB cluster and not exposed to the public internet.
For example, the following `EXPLAIN (DISTSQL)` statement generates a physical plan for a simple query against the [TPC-H database](http://www.tpc.org/tpch/) loaded to a 3-node CockroachDB cluster:
```sql theme={"theme":{"light":"catppuccin-mocha","dark":"catppuccin-mocha"}}
EXPLAIN (DISTSQL) SELECT l_shipmode, AVG(l_extendedprice) FROM lineitem GROUP BY l_shipmode;
```
The output of `EXPLAIN (DISTSQL)` is a URL for a graphical diagram that displays the processors and operations that make up the physical statement plan. For details about the physical statement plan, see DistSQL plan diagram.
```
automatic | url
-----------+----------------------------------------------
true | https://cockroachdb.github.io/distsqlplan ...
```
To view the DistSQL plan diagram, open the URL. You should see the following:
## Required privileges
The user requires the appropriate privileges for the statement being explained.
## Parameters
| Parameter | Description |
| ----------------- | -------------------------------------------------------------------------------------------------------------------------------------------------------------------------------------- |
| `VERBOSE` | Show as much information as possible about the statement plan. See [`VERBOSE` option](#verbose-option). |
| `TYPES` | Include the intermediate data types CockroachDB chooses to evaluate intermediate SQL expressions. See [`TYPES` option](#types-option). |
| `OPT` | Display the statement plan tree generated by the cost-based optimizer. See [`OPT` option](#opt-option). |
| `ENV` | Include all details used by the optimizer, including statistics. See [`ENV` suboption](#opt-env-option). |
| `MEMO` | Print a representation of the optimizer memo with the best plan. See [`MEMO` suboption](#opt-memo-option). |
| `REDACT` | Redact constants, literal values, parameter values, and personally identifiable information (PII) from the output. See [`REDACT` option](#redact-option). |
| `VEC` | Show detailed information about the vectorized execution plan for a query. See [`VEC` option](#vec-option). |
| `DISTSQL` | Generate a URL to a distributed SQL physical statement plan diagram. See [`DISTSQL` option](#distsql-option). |
| `preparable_stmt` | The statement you want details about. All preparable statements are explainable. |
## Success responses
A successful `EXPLAIN` statement returns a table with the following details in the `info` column:
| Detail | Description |
| ----------------------------------------------------------------- | ------------------------------------------------------------------------------------------------------------------------------------------------------------------------------------------------------------------------------------------------------------------------------------------------------------------------------------------------------------------------- |
| [Global properties](#global-properties) | The properties and statistics that apply to the entire statement plan. |
| [Statement plan tree properties](#statement-plan-tree-properties) | A tree representation of the hierarchy of the statement plan. |
| Node details | The properties, columns, and ordering details for the current statement plan node in the tree. |
| `index recommendations` | Number of index recommendations followed by a list of index actions and SQL statements to perform the actions. |
| `Time` | The time details for the query. The total time is the planning and execution time of the query. The execution time is the time it took for the final statement plan to complete. The network time is the amount of time it took to distribute the query across the relevant nodes in the cluster. Some queries do not need to be distributed, so the network time is 0ms. |
### Global properties
| Property | Description |
| -------------- | ----------------------------------------------------------------------------------------------------------------------------------------------------------------------------------------------------------------------------------------------------------------------------------------------------------------------------------------------------------------------------------------------------------------------------- |
| `distribution` | Whether the statement was distributed or local. If `distribution` is `full`, execution of the statement is performed by multiple nodes in parallel, then the results are returned by the gateway node. If `local`, the execution plan is performed only on the gateway node. Even if the execution plan is `local`, row data may be fetched from remote nodes, but the processing of the data is performed by the local node. |
| `vectorized` | Whether the vectorized execution engine was used in this statement. |
### Statement plan tree properties
| Property | Description |
| --------------------- | ---------------------------------------------------------------------------------------------------------------------------------------------------------------------------------------------------------------------------------------------------------------------------------------------------------------------------------------------------------------------------------------------------------------------------------------------------------------------------------------------------------------------- |
| `processor` | Each processor in the statement plan hierarchy has a node with details about that phase of the statement. For example, a statement with a `GROUP BY` clause has a `group` processor with details about the cluster nodes, rows, and operations related to the `GROUP BY` operation. |
| `estimated row count` | The estimated number of rows affected by this processor according to the statement planner, the percentage of the table the query spans, and when the statistics for the table were last collected. |
| `table` | The table and index used in a scan operation in a statement, in the form `{table name}@{index name}`. |
| `spans` | The interval of the key space read by the processor. `FULL SCAN` indicates that the table is scanned on all key ranges of the index (also known as a "full table scan" or "unlimited full scan"). `FULL SCAN (SOFT LIMIT)` indicates that a full table scan can be performed, but will halt early once enough rows have been scanned. `LIMITED SCAN` indicates that the table will be scanned on a subset of key ranges of the index. `[/1 - /1]` indicates that only the key with value `1` is read by the processor. |
## Examples
The following examples use the `movr` example dataset.
Start the MovR database on a 3-node CockroachDB demo cluster with a larger data set.
```shell theme={"theme":{"light":"catppuccin-mocha","dark":"catppuccin-mocha"}}
cockroach demo movr --num-histories 250000 --num-promo-codes 250000 --num-rides 125000 --num-users 12500 --num-vehicles 3750 --nodes 3
```
### Default statement plans
By default, `EXPLAIN` includes the least detail about the statement plan but can be useful to find out which indexes and index key ranges are used by a query. For example:
```sql theme={"theme":{"light":"catppuccin-mocha","dark":"catppuccin-mocha"}}
EXPLAIN SELECT * FROM rides WHERE revenue > 90 ORDER BY revenue ASC;
```
```
info
---------------------------------------------------------------------------------------------------------------------------------------------------
distribution: full
vectorized: true
• sort
│ estimated row count: 12,385
│ order: +revenue
│
└── • filter
│ estimated row count: 12,385
│ filter: revenue > 90
│
└── • scan
estimated row count: 125,000 (100% of the table; stats collected 19 minutes ago)
table: rides@rides_pkey
spans: FULL SCAN
index recommendations: 1
1. type: index creation
SQL command: CREATE INDEX ON rides (revenue) STORING (vehicle_city, rider_id, vehicle_id, start_address, end_address, start_time, end_time);
(19 rows)
Time: 2ms total (execution 2ms / network 0ms)
```
The output shows the tree structure of the statement plan, in this case a `sort`, a `filter`, and a `scan`.
The output also describes a set of properties, some global to the query, some specific to an operation listed in the true structure (in this case, `sort`, `filter`, or `scan`), and an index recommendation:
* `distribution`:`full`
The planner chose a distributed execution plan, where execution of the query is performed by multiple nodes in parallel, then the results are returned by the gateway node. An execution plan with `full` distribution doesn't process on all nodes in the cluster. It is executed simultaneously on multiple nodes. An execution plan with `local` distribution is performed only on the gateway node. Even if the execution plan is `local`, row data may be fetched from remote nodes, but the processing of the data is performed by the local node.
* `vectorized`:`true`
The plan will be executed with the vectorized execution engine.
* `order`:`+revenue`
The sort will be ordered ascending on the `revenue` column.
* `filter`: `revenue > 90`
The scan filters on the `revenue` column.
* `estimated row count`:`125,000 (100% of the table; stats collected 19 minutes ago)`
The estimated number of rows scanned by the query, in this case, `125,000` rows of data; the percentage of the table the query spans, in this case 100%; and when the statistics for the table were last collected, in this case 19 minutes ago. If you do not see statistics, you can manually generate table statistics with `CREATE STATISTICS` or configure more frequent statistics generation following the steps in Control automatic statistics.
* `table`:`rides@rides_pkey`
The table is scanned on the `rides_pkey` index.
* `spans`:`FULL SCAN`
The table is scanned on all key ranges of the `rides_pkey` index (also known as a "full table scan" or "unlimited full scan"). For more information on indexes and key ranges, see the following [example](#find-the-indexes-and-key-ranges-a-query-uses).
* `index recommendations: 1`
The number of index recommendations, followed by the recommendation and statement. The recommendation to create an index on the `rides` table and store the `vehicle_city`, `rider_id`, `vehicle_id`, `start_address`, `end_address`, `start_time`, and `end_time` columns will eliminate the full scan of the `rides` table.
Index recommendations are displayed by default. To disable index recommendations, set the `index_recommendations_enabled` session variable to `false`.
Suppose you create the recommended index:
```
CREATE INDEX ON rides (revenue) STORING (vehicle_city, rider_id, vehicle_id, start_address, end_address, start_time, end_time);
```
The next `EXPLAIN` call demonstrates that the estimated row count is 10% of the table:
```sql theme={"theme":{"light":"catppuccin-mocha","dark":"catppuccin-mocha"}}
EXPLAIN SELECT * FROM rides WHERE revenue > 90 ORDER BY revenue ASC;
```
```
info
------------------------------------------------------------------------------------
distribution: local
vectorized: true
• scan
estimated row count: 12,647 (10% of the table; stats collected 22 seconds ago)
table: rides@rides_revenue_idx
spans: (/90 - ]
(7 rows)
```
If you then limit the number of returned rows:
```sql theme={"theme":{"light":"catppuccin-mocha","dark":"catppuccin-mocha"}}
EXPLAIN SELECT * FROM rides WHERE revenue > 90 ORDER BY revenue ASC limit 10;
```
The limit is reflected both in the estimated row count and a `limit` property:
```
info
-----------------------------------------------------------------------------------
distribution: local
vectorized: true
• scan
estimated row count: 10 (<0.01% of the table; stats collected 32 seconds ago)
table: rides@rides_revenue_idx
spans: (/90 - ]
limit: 10
(8 rows)
```
### Join queries
If you run `EXPLAIN` on a join query, the output will display which type of join will be executed. For example, the following `EXPLAIN` output shows that the query will perform a hash join:
```sql theme={"theme":{"light":"catppuccin-mocha","dark":"catppuccin-mocha"}}
EXPLAIN SELECT * FROM rides AS r
JOIN users AS u ON r.rider_id = u.id;
```
```
info
---------------------------------------------------------------------------------------------------------------------------------------------------
distribution: full
vectorized: true
• hash join
│ estimated row count: 124,482
│ equality: (rider_id) = (id)
│
├── • scan
│ estimated row count: 125,000 (100% of the table; stats collected 13 minutes ago)
│ table: rides@rides_pkey
│ spans: FULL SCAN
│
└── • scan
estimated row count: 12,500 (100% of the table; stats collected 14 minutes ago)
table: users@users_pkey
spans: FULL SCAN
index recommendations: 2
1. type: index creation
SQL command: CREATE INDEX ON rides (rider_id) STORING (vehicle_city, vehicle_id, start_address, end_address, start_time, end_time, revenue);
1. type: index creation
SQL command: CREATE INDEX ON users (id) STORING (name, address, credit_card);
(22 rows)
Time: 2ms total (execution 2ms / network 0ms)
```
The following output shows that the query will perform a cross join:
```sql theme={"theme":{"light":"catppuccin-mocha","dark":"catppuccin-mocha"}}
EXPLAIN SELECT * FROM rides AS r
JOIN users AS u ON r.city = 'new york';
```
```
info
-----------------------------------------------------------------------------------------
distribution: full
vectorized: true
• cross join
│ estimated row count: 178,283,221
│
├── • scan
│ estimated row count: 14,263 (11% of the table; stats collected 14 minutes ago)
│ table: rides@rides_pkey
│ spans: [/'new york' - /'new york']
│
└── • scan
estimated row count: 12,500 (100% of the table; stats collected 15 minutes ago)
table: users@users_pkey
spans: FULL SCAN
(15 rows)
Time: 2ms total (execution 2ms / network 0ms)
```
### Insert queries
`EXPLAIN` output for `INSERT` queries is similar to the output for standard `SELECT` queries. For example:
```sql theme={"theme":{"light":"catppuccin-mocha","dark":"catppuccin-mocha"}}
EXPLAIN INSERT INTO users(id, city, name) VALUES ('c28f5c28-f5c2-4000-8000-000000000026', 'new york', 'Petee');
```
```
info
-------------------------------------------------------
distribution: local
vectorized: true
• insert fast path
into: users(id, city, name, address, credit_card)
auto commit
size: 5 columns, 1 row
(7 rows)
Time: 1ms total (execution 1ms / network 0ms)
```
The output for this `INSERT` lists the primary operation (in this case, `insert`), and the table and columns affected by the operation in the `into` field (in this case, the `id`, `city`, `name`, `address`, and `credit_card` columns of the `users` table). The output also includes the size of the `INSERT` in the `size` field (in this case, 5 columns in a single row).
For more complex types of `INSERT` queries, `EXPLAIN` output can include more information. For example, suppose that you create a `UNIQUE` index on the `users` table:
```sql theme={"theme":{"light":"catppuccin-mocha","dark":"catppuccin-mocha"}}
CREATE UNIQUE INDEX ON users(city, id, name);
```
To display the `EXPLAIN` output for an `INSERT ... ON CONFLICT` statement, which inserts some data that might conflict with the `UNIQUE` constraint imposed on the `name`, `city`, and `id` columns, run:
```sql theme={"theme":{"light":"catppuccin-mocha","dark":"catppuccin-mocha"}}
EXPLAIN INSERT INTO users(id, city, name) VALUES ('c28f5c28-f5c2-4000-8000-000000000026', 'new york', 'Petee') ON CONFLICT DO NOTHING;
```
```
info
----------------------------------------------------------------------------------------------------------------------------------
distribution: local
vectorized: true
• insert
│ into: users(id, city, name, address, credit_card)
│ auto commit
│ arbiter indexes: users_pkey, users_city_id_name_key
│
└── • lookup join (anti)
│ estimated row count: 0
│ table: users@users_city_id_name_key
│ equality: (city_cast, column1, name_cast) = (city,id,name)
│ equality cols are key
│
└── • cross join (anti)
│ estimated row count: 0
│
├── • values
│ size: 4 columns, 1 row
│
└── • scan
estimated row count: 1 (<0.01% of the table; stats collected 18 minutes ago)
table: users@users_city_id_name_key
spans: [/'new york'/'c28f5c28-f5c2-4000-8000-000000000026' - /'new york'/'c28f5c28-f5c2-4000-8000-000000000026']
(24 rows)
Time: 3ms total (execution 3ms / network 0ms)
```
Because the `INSERT` includes an `ON CONFLICT` clause, the query requires more than a simple `insert` operation. CockroachDB must check the provided values against the values in the database, to ensure that the `UNIQUE` constraint on `name`, `city`, and `id` is not violated. The output also lists the indexes available to detect conflicts (the `arbiter indexes`), including the `users_city_id_name_key` index.
### Alter queries
If you alter a table to split a range as described in Split a table, the `EXPLAIN` command returns the target table and index names and a `NULL` expiry timestamp:
```sql theme={"theme":{"light":"catppuccin-mocha","dark":"catppuccin-mocha"}}
EXPLAIN ALTER TABLE users SPLIT AT VALUES ('chicago'), ('new york'), ('seattle');
```
```
info
----------------------------------
distribution: local
vectorized: true
• split
│ index: users@users_pkey
│ expiry: CAST(NULL AS STRING)
│
└── • values
size: 1 column, 3 rows
(9 rows)
```
If you alter a table to split a range as described in Set the expiration on a split enforcement, the `EXPLAIN` command returns the target table and index names and the expiry timestamp:
```sql theme={"theme":{"light":"catppuccin-mocha","dark":"catppuccin-mocha"}}
EXPLAIN ALTER TABLE vehicles SPLIT AT VALUES ('chicago'), ('new york'), ('seattle') WITH EXPIRATION '2022-08-10 23:30:00+00:00';
```
```
info
-----------------------------------------
distribution: local
vectorized: true
• split
│ index: vehicles@vehicles_pkey
│ expiry: '2022-08-10 23:30:00+00:00'
│
└── • values
size: 1 column, 3 rows
(9 rows)
```
### Options
#### `VERBOSE` option
The `VERBOSE` option includes:
* SQL expressions that are involved in each processing stage, providing more granular detail about which portion of your query is represented at each level.
* Detail about which columns are being used by each level, as well as properties of the result set on that level.
```sql theme={"theme":{"light":"catppuccin-mocha","dark":"catppuccin-mocha"}}
EXPLAIN (VERBOSE) SELECT * FROM rides AS r
JOIN users AS u ON r.rider_id = u.id
WHERE r.city = 'new york'
ORDER BY r.revenue ASC;
```
```
info
------------------------------------------------------------------------------------------------------------------------------------------------------------------
distribution: full
vectorized: true
• sort
│ columns: (id, city, vehicle_city, rider_id, vehicle_id, start_address, end_address, start_time, end_time, revenue, id, city, name, address, credit_card)
│ ordering: +revenue
│ estimated row count: 14,087
│ order: +revenue
│
└── • hash join (inner)
│ columns: (id, city, vehicle_city, rider_id, vehicle_id, start_address, end_address, start_time, end_time, revenue, id, city, name, address, credit_card)
│ estimated row count: 14,087
│ equality: (rider_id) = (id)
│
├── • scan
│ columns: (id, city, vehicle_city, rider_id, vehicle_id, start_address, end_address, start_time, end_time, revenue)
│ estimated row count: 14,087 (11% of the table; stats collected 29 minutes ago)
│ table: rides@rides_pkey
│ spans: /"new york"-/"new york"/PrefixEnd
│
└── • scan
columns: (id, city, name, address, credit_card)
estimated row count: 12,500 (100% of the table; stats collected 42 seconds ago)
table: users@users_pkey
spans: FULL SCAN
(25 rows)
Time: 2ms total (execution 2ms / network 0ms)
```
#### `TYPES` option
The `TYPES` option includes:
* The types of the values used in the statement plan.
* The SQL expressions that were involved in each processing stage, and the columns used by each level.
* All information that is included with the [`VERBOSE`](#verbose-option) option.
```sql theme={"theme":{"light":"catppuccin-mocha","dark":"catppuccin-mocha"}}
EXPLAIN (TYPES) SELECT * FROM rides WHERE revenue > 90 ORDER BY revenue ASC;
```
```
info
----------------------------------------------------------------------------------------------------
distribution: full
vectorized: true
• sort
│ columns: (id uuid, city varchar, vehicle_city varchar, rider_id uuid, vehicle_id uuid, start_address varchar, end_address varchar, start_time timestamp, end_time timestamp, revenue decimal)
│ ordering: +revenue
│ estimated row count: 12,317
│ order: +revenue
│
└── • filter
│ columns: (id uuid, city varchar, vehicle_city varchar, rider_id uuid, vehicle_id uuid, start_address varchar, end_address varchar, start_time timestamp, end_time timestamp, revenue decimal)
│ estimated row count: 12,317
│ filter: ((revenue)[decimal] > (90)[decimal])[bool]
│
└── • scan
columns: (id uuid, city varchar, vehicle_city varchar, rider_id uuid, vehicle_id uuid, start_address varchar, end_address varchar, start_time timestamp, end_time timestamp, revenue decimal)
estimated row count: 125,000 (100% of the table; stats collected 29 minutes ago)
table: rides@rides_pkey
spans: FULL SCAN
(19 rows)
Time: 1ms total (execution 1ms / network 0ms)
```
#### `REDACT` option
The `REDACT` option causes constants, literal values, parameter values, and personally identifiable information (PII) to be redacted as `‹×›` in the physical statement plan.
You can also use `REDACT` with the [`OPT`](#opt-option) option and its suboptions.
```sql theme={"theme":{"light":"catppuccin-mocha","dark":"catppuccin-mocha"}}
EXPLAIN (REDACT) SELECT * FROM rides WHERE revenue > 90 ORDER BY revenue ASC;
```
```
info
---------------------------------------------------------------------------------------------------------------------------------------------------------------
distribution: local
vectorized: true
• sort
│ estimated row count: 12,156
│ order: +revenue
│
└── • filter
│ estimated row count: 12,156
│ filter: revenue > ‹×›
│
└── • scan
estimated row count: 125,000 (100% of the table; stats collected 22 hours ago)
table: rides@rides_pkey
spans: FULL SCAN
index recommendations: 1
1. type: index creation
SQL command: CREATE INDEX ON movr.public.rides (revenue) STORING (vehicle_city, rider_id, vehicle_id, start_address, end_address, start_time, end_time);
(19 rows)
Time: 5ms total (execution 5ms / network 0ms)
```
In the preceding output, the `revenue` comparison value is redacted as `‹×›`.
#### `OPT` option
To display the statement plan tree generated by the cost-based optimizer, use the `OPT` option . For example:
```sql theme={"theme":{"light":"catppuccin-mocha","dark":"catppuccin-mocha"}}
EXPLAIN (OPT) SELECT * FROM rides WHERE revenue > 90 ORDER BY revenue ASC;
```
```
info
-------------------------------
sort
└── select
├── scan rides
└── filters
└── revenue > 90
(5 rows)
Time: 1ms total (execution 1ms / network 0ms)
```
`OPT` has five suboptions: [`VERBOSE`](#opt-verbose-option), [`TYPES`](#opt-types-option), [`ENV`](#opt-env-option), [`MEMO`](#opt-memo-option), [`REDACT`](#opt-redact-option).
##### `OPT, VERBOSE` option
To include cost details used by the optimizer in planning the query, use the `OPT, VERBOSE` option:
```sql theme={"theme":{"light":"catppuccin-mocha","dark":"catppuccin-mocha"}}
EXPLAIN (OPT, VERBOSE) SELECT * FROM rides WHERE revenue > 90 ORDER BY revenue ASC;
```
```
info
---------------------------------------------------------------------------------------------------- ...
sort
├── columns: id:1 city:2 vehicle_city:3 rider_id:4 vehicle_id:5 start_address:6 end_address:7 start_time:8 end_time:9 revenue:10
├── immutable
├── stats: [rows=12316.644, distinct(10)=9.90909091, null(10)=0]
│ histogram(10)= 0 0 11130 1187
│ <--- 90 ------- 99
├── cost: 156091.288
├── key: (1,2)
├── fd: (1,2)-->(3-10)
├── ordering: +10
├── prune: (1-9)
├── interesting orderings: (+2,+1) (+2,+4,+1) (+3,+5,+2,+1) (+8,+2,+1) (+4,+2,+1)
└── select
├── columns: id:1 city:2 vehicle_city:3 rider_id:4 vehicle_id:5 start_address:6 end_address:7 start_time:8 end_time:9 revenue:10
├── immutable
├── stats: [rows=12316.644, distinct(10)=9.90909091, null(10)=0]
│ histogram(10)= 0 0 11130 1187
│ <--- 90 ------- 99
├── cost: 151266.03
├── key: (1,2)
├── fd: (1,2)-->(3-10)
├── prune: (1-9)
├── interesting orderings: (+2,+1) (+2,+4,+1) (+3,+5,+2,+1) (+8,+2,+1) (+4,+2,+1)
├── scan rides
│ ├── columns: id:1 city:2 vehicle_city:3 rider_id:4 vehicle_id:5 start_address:6 end_address:7 start_time:8 end_time:9 revenue:10
│ ├── stats: [rows=125000, distinct(1)=125000, null(1)=0, distinct(2)=9, null(2)=0, distinct(10)=100, null(10)=0]
│ │ histogram(1)= 0 12 612 12 612 12 612
<--- '00064a9c-dc44-4915-8000-00000000000c' ----- '0162f166-e008-49b0-8000-0000000002a5' ----- '02834d26-fa3f-4ca0-8000-0000000004cb' ----- '03c85c24-c404-4720-
│ │ histogram(2)= 0 14512 0 13637 0 14512 0 14087 0 13837 0 13737 0 13550 0 13412 0 13712
│ │ <--- 'amsterdam' --- 'boston' --- 'los angeles' --- 'new york' --- 'paris' --- 'rome' --- 'san francisco' --- 'seattle' --- 'washington dc'
│ │ histogram(10)= 0 1387 1.2242e+05 1187
│ │ <--- 0 ------------- 99
│ ├── cost: 150016.01
│ ├── key: (1,2)
│ ├── fd: (1,2)-->(3-10)
│ ├── prune: (1-10)
│ └── interesting orderings: (+2,+1) (+2,+4,+1) (+3,+5,+2,+1) (+8,+2,+1) (+4,+2,+1)
└── filters
└── revenue:10 > 90 [outer=(10), immutable, constraints=(/10: (/90 - ]; tight)]
(39 rows)
Time: 4ms total (execution 3ms / network 1ms)
```
##### `OPT, TYPES` option
To include cost and type details, use the `OPT, TYPES` option:
```sql theme={"theme":{"light":"catppuccin-mocha","dark":"catppuccin-mocha"}}
EXPLAIN (OPT, TYPES) SELECT * FROM rides WHERE revenue > 90 ORDER BY revenue ASC;
```
```
info
---------------------------------------------------------------------------------------------------- ...
sort
├── columns: id:1(uuid!null) city:2(varchar!null) vehicle_city:3(varchar) rider_id:4(uuid) vehicle_id:5(uuid) start_address:6(varchar) end_address:7(varchar) start_time:8(timestamp) end_time:9(timestamp) revenue:10(decimal!null)
├── immutable
├── stats: [rows=12316.644, distinct(10)=9.90909091, null(10)=0]
│ histogram(10)= 0 0 11130 1187
│ <--- 90 ------- 99
├── cost: 156091.288
├── key: (1,2)
├── fd: (1,2)-->(3-10)
├── ordering: +10
├── prune: (1-9)
├── interesting orderings: (+2,+1) (+2,+4,+1) (+3,+5,+2,+1) (+8,+2,+1) (+4,+2,+1)
└── select
├── columns: id:1(uuid!null) city:2(varchar!null) vehicle_city:3(varchar) rider_id:4(uuid) vehicle_id:5(uuid) start_address:6(varchar) end_address:7(varchar) start_time:8(timestamp) end_time:9(timestamp) revenue:10(decimal!null)
├── immutable
├── stats: [rows=12316.644, distinct(10)=9.90909091, null(10)=0]
│ histogram(10)= 0 0 11130 1187
│ <--- 90 ------- 99
├── cost: 151266.03
├── key: (1,2)
├── fd: (1,2)-->(3-10)
├── prune: (1-9)
├── interesting orderings: (+2,+1) (+2,+4,+1) (+3,+5,+2,+1) (+8,+2,+1) (+4,+2,+1)
├── scan rides
│ ├── columns: id:1(uuid!null) city:2(varchar!null) vehicle_city:3(varchar) rider_id:4(uuid) vehicle_id:5(uuid) start_address:6(varchar) end_address:7(varchar) start_time:8(timestamp) end_time:9(timestamp) revenue:10(decimal)
│ ├── stats: [rows=125000, distinct(1)=125000, null(1)=0, distinct(2)=9, null(2)=0, distinct(10)=100, null(10)=0]
│ │ histogram(1)= 0 12 612 12 612 12 612
│ │ <--- '00064a9c-dc44-4915-8000-00000000000c' ----- '0162f166-e008-49b0-8000-0000000002a5' ----- '02834d26-fa3f-4ca0-8000-0000000004cb' ----- '03c85c24-c404-4720-
│ │ histogram(2)= 0 14512 0 13637 0 14512 0 14087 0 13837 0 13737 0 13550 0 13412 0 13712
│ │ <--- 'amsterdam' --- 'boston' --- 'los angeles' --- 'new york' --- 'paris' --- 'rome' --- 'san francisco' --- 'seattle' --- 'washington dc'
│ │ histogram(10)= 0 1387 1.2242e+05 1187
│ │ <--- 0 ------------- 99
│ ├── cost: 150016.01
│ ├── key: (1,2)
│ ├── fd: (1,2)-->(3-10)
│ ├── prune: (1-10)
│ └── interesting orderings: (+2,+1) (+2,+4,+1) (+3,+5,+2,+1) (+8,+2,+1) (+4,+2,+1)
└── filters
└── gt [type=bool, outer=(10), immutable, constraints=(/10: (/90 - ]; tight)]
├── variable: revenue:10 [type=decimal]
└── const: 90 [type=decimal]
(41 rows)
Time: 4ms total (execution 3ms / network 1ms)
```
##### `OPT, ENV` option
To include all details used by the optimizer, including statistics, use the `OPT, ENV` option.
```sql theme={"theme":{"light":"catppuccin-mocha","dark":"catppuccin-mocha"}}
EXPLAIN (OPT, ENV) SELECT * FROM rides WHERE revenue > 90 ORDER BY revenue ASC;
```
The output of `EXPLAIN (OPT, ENV)` is a URL with the data encoded in the fragment portion. Encoding the data makes it easier to share debugging information across different systems without encountering formatting issues. Opening the URL shows a page with the decoded data. The data is processed in the local browser session and is never sent out over the network. Keep in mind that if you are using any browser extensions, they may be able to access the data locally.
```
info
----------------------------------------------------------------- ...
https://cockroachdb.github.io/text/decode.html#eJzsm9Fum0gXx6_L ...
(1 row)
Time: 32ms total (execution 32ms / network 0ms)
```
When you open the URL you should see the following output in your browser.
```
-- Version: CockroachDB CCL
-- reorder_joins_limit has the default value: 8
-- enable_zigzag_join has the default value: on
-- optimizer_use_histograms has the default value: on
-- optimizer_use_multicol_stats has the default value: on
-- locality_optimized_partitioned_index_scan has the default value: on
-- distsql has the default value: auto
-- vectorize has the default value: on
CREATE TABLE public.rides (
id UUID NOT NULL,
city VARCHAR NOT NULL,
vehicle_city VARCHAR NULL,
rider_id UUID NULL,
vehicle_id UUID NULL,
start_address VARCHAR NULL,
end_address VARCHAR NULL,
start_time TIMESTAMP NULL,
end_time TIMESTAMP NULL,
revenue DECIMAL(10,2) NULL,
CONSTRAINT "primary" PRIMARY KEY (city ASC, id ASC),
CONSTRAINT fk_city_ref_users FOREIGN KEY (city, rider_id) REFERENCES public.users(city, id),
CONSTRAINT fk_vehicle_city_ref_vehicles FOREIGN KEY (vehicle_city, vehicle_id) REFERENCES public.vehicles(city, id),
INDEX rides_auto_index_fk_city_ref_users (city ASC, rider_id ASC),
INDEX rides_auto_index_fk_vehicle_city_ref_vehicles (vehicle_city ASC, vehicle_id ASC),
INDEX rides_start_time_idx (start_time ASC) STORING (rider_id),
INDEX rides_rider_id_idx (rider_id ASC),
FAMILY "primary" (id, city, vehicle_city, rider_id, vehicle_id, start_address, end_address, start_time, end_time, revenue),
CONSTRAINT check_vehicle_city_city CHECK (vehicle_city = city)
);
ALTER TABLE movr.public.rides INJECT STATISTICS '[
{
"columns": [
"city"
],
"created_at": "2021-03-16 17:27:01.301903",
"distinct_count": 9,
"histo_col_type": "STRING",
"name": "__auto__",
"null_count": 0,
"row_count": 125000
},
{
"columns": [
"id"
],
"created_at": "2021-03-16 17:27:01.301903",
"distinct_count": 125617,
"histo_col_type": "UUID",
"name": "__auto__",
"null_count": 0,
"row_count": 125000
},
{
"columns": [
"city",
"id"
],
"created_at": "2021-03-16 17:27:01.301903",
"distinct_count": 124937,
"histo_col_type": "",
"name": "__auto__",
"null_count": 0,
"row_count": 125000
},
...
]';
EXPLAIN (OPT, ENV) SELECT * FROM rides WHERE revenue > 90 ORDER BY revenue ASC;
----
sort
└── select
├── scan rides
└── filters
└── revenue > 90
```
##### `OPT, MEMO` option
The `MEMO` suboption prints a representation of the optimizer memo with the best plan. You can use the `MEMO` flag in combination with other flags. For example, `EXPLAIN (OPT, MEMO, VERBOSE)` prints the memo along with verbose output for the best plan.
```sql theme={"theme":{"light":"catppuccin-mocha","dark":"catppuccin-mocha"}}
EXPLAIN (OPT, MEMO) SELECT * FROM rides WHERE revenue > 90 ORDER BY revenue ASC;
```
```
info
---------------------------------------------------------------------------------------------------- ...
memo (optimized, ~5KB, required=[presentation: info:13])
├── G1: (explain G2 [presentation: id:1,city:2,vehicle_city:3,rider_id:4,vehicle_id:5,start_address:6,end_address:7,start_time:8,end_time:9,revenue:10] [ordering: +10])
│ └── [presentation: info:13]
│ ├── best: (explain G2="[presentation: id:1,city:2,vehicle_city:3,rider_id:4,vehicle_id:5,start_address:6,end_address:7,start_time:8,end_time:9,revenue:10] [ordering: +10]" [presentation: id:1,city:2,vehicle_city:3,rider_id:4,vehicle_id:5,start_address:6,end_address:7,start_time:8,end_time:9,revenue:10] [ordering: +10])
│ └── cost: 2939.68
├── G2: (select G3 G4)
│ ├── [presentation: id:1,city:2,vehicle_city:3,rider_id:4,vehicle_id:5,start_address:6,end_address:7,start_time:8,end_time:9,revenue:10] [ordering: +10]
│ │ ├── best: (sort G2)
│ │ └── cost: 2939.66
│ └── []
│ ├── best: (select G3 G4)
│ └── cost: 2883.30
├── G3: (scan rides,cols=(1-10))
│ ├── [ordering: +10]
│ │ ├── best: (sort G3)
│ │ └── cost: 3551.50
│ └── []
│ ├── best: (scan rides,cols=(1-10))
│ └── cost: 2863.02
├── G4: (filters G5)
├── G5: (gt G6 G7)
├── G6: (variable revenue)
└── G7: (const 90)
sort
└── select
├── scan rides
└── filters
└── revenue > 90
(28 rows)
Time: 2ms total (execution 2ms / network 1ms)
```
##### `OPT, REDACT` option
The `REDACT` suboption causes constants, literal values, parameter values, and personally identifiable information (PII) to be redacted as `‹×›` in the physical statement plan.
You can also use the `REDACT` option in combination with the [`VERBOSE`](#opt-verbose-option), [`TYPES`](#opt-types-option), and [`MEMO`](#opt-memo-option) suboptions.
```sql theme={"theme":{"light":"catppuccin-mocha","dark":"catppuccin-mocha"}}
EXPLAIN (OPT, REDACT) SELECT * FROM rides WHERE revenue > 90 ORDER BY revenue ASC;
```
```
info
-------------------------------------
distribute
└── sort
└── select
├── scan rides
└── filters
└── revenue > ‹×›
(6 rows)
```
In the preceding output, the `revenue` comparison value is redacted as `‹×›`.
#### `VEC` option
To view details about the vectorized execution plan for the query, use the `VEC` option.
```sql theme={"theme":{"light":"catppuccin-mocha","dark":"catppuccin-mocha"}}
EXPLAIN (VEC) SELECT * FROM rides WHERE revenue > 90 ORDER BY revenue ASC;
```
The output shows the different internal functions that will be used to process each batch of column-oriented data.
```
info
------------------------------------------------
│
└ Node 1
└ *colexec.sortOp
└ *colexecsel.selGTDecimalDecimalConstOp
└ *colfetcher.ColBatchScan
(5 rows)
Time: 1ms total (execution 1ms / network 0ms)
```
#### `DISTSQL` option
To view a physical statement plan that provides high level information about how a query will be executed, use the `DISTSQL` option. For more information about distributed SQL queries, see the DistSQL section of our SQL layer architecture.
The generated physical statement plan is encoded into a byte string after the [fragment identifier (`#`)](https://wikipedia.org/wiki/Fragment_identifier) in the generated URL. The fragment is not sent to the web server; instead, the browser waits for the web server to return a `decode.html` resource, and then JavaScript on the web page decodes the fragment into a physical statement plan diagram. The statement plan is, therefore, not logged by a server external to the CockroachDB cluster and not exposed to the public internet.
For example, the following `EXPLAIN (DISTSQL)` statement generates a physical plan for a simple query against the [TPC-H database](http://www.tpc.org/tpch/) loaded to a 3-node CockroachDB cluster:
```sql theme={"theme":{"light":"catppuccin-mocha","dark":"catppuccin-mocha"}}
EXPLAIN (DISTSQL) SELECT l_shipmode, AVG(l_extendedprice) FROM lineitem GROUP BY l_shipmode;
```
The output of `EXPLAIN (DISTSQL)` is a URL for a graphical diagram that displays the processors and operations that make up the physical statement plan. For details about the physical statement plan, see DistSQL plan diagram.
```
automatic | url
-----------+----------------------------------------------
true | https://cockroachdb.github.io/distsqlplan ...
```
To view the DistSQL plan diagram, open the URL. You should see the following:
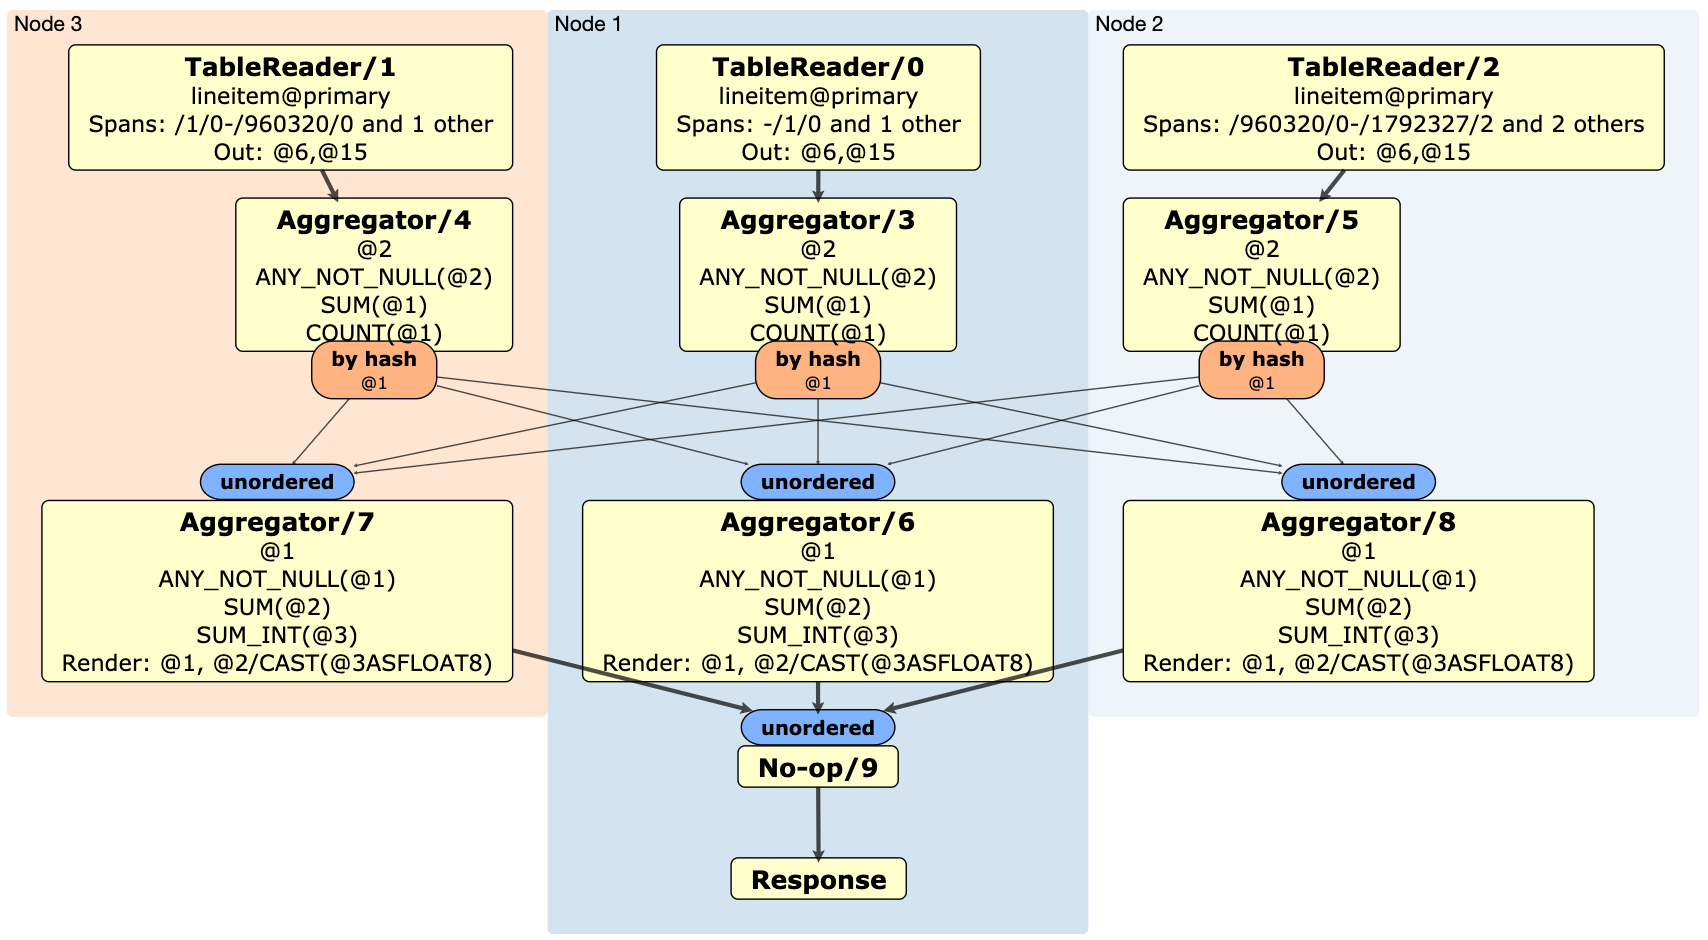 To include the data types of the input columns in the physical plan, use `EXPLAIN(DISTSQL, TYPES)`:
```sql theme={"theme":{"light":"catppuccin-mocha","dark":"catppuccin-mocha"}}
EXPLAIN (DISTSQL, TYPES) SELECT l_shipmode, AVG(l_extendedprice) FROM lineitem GROUP BY l_shipmode;
```
```
automatic | url
-----------+----------------------------------------------
true | https://cockroachdb.github.io/distsqlplan ...
```
Open the URL. You should see the following:
To include the data types of the input columns in the physical plan, use `EXPLAIN(DISTSQL, TYPES)`:
```sql theme={"theme":{"light":"catppuccin-mocha","dark":"catppuccin-mocha"}}
EXPLAIN (DISTSQL, TYPES) SELECT l_shipmode, AVG(l_extendedprice) FROM lineitem GROUP BY l_shipmode;
```
```
automatic | url
-----------+----------------------------------------------
true | https://cockroachdb.github.io/distsqlplan ...
```
Open the URL. You should see the following:
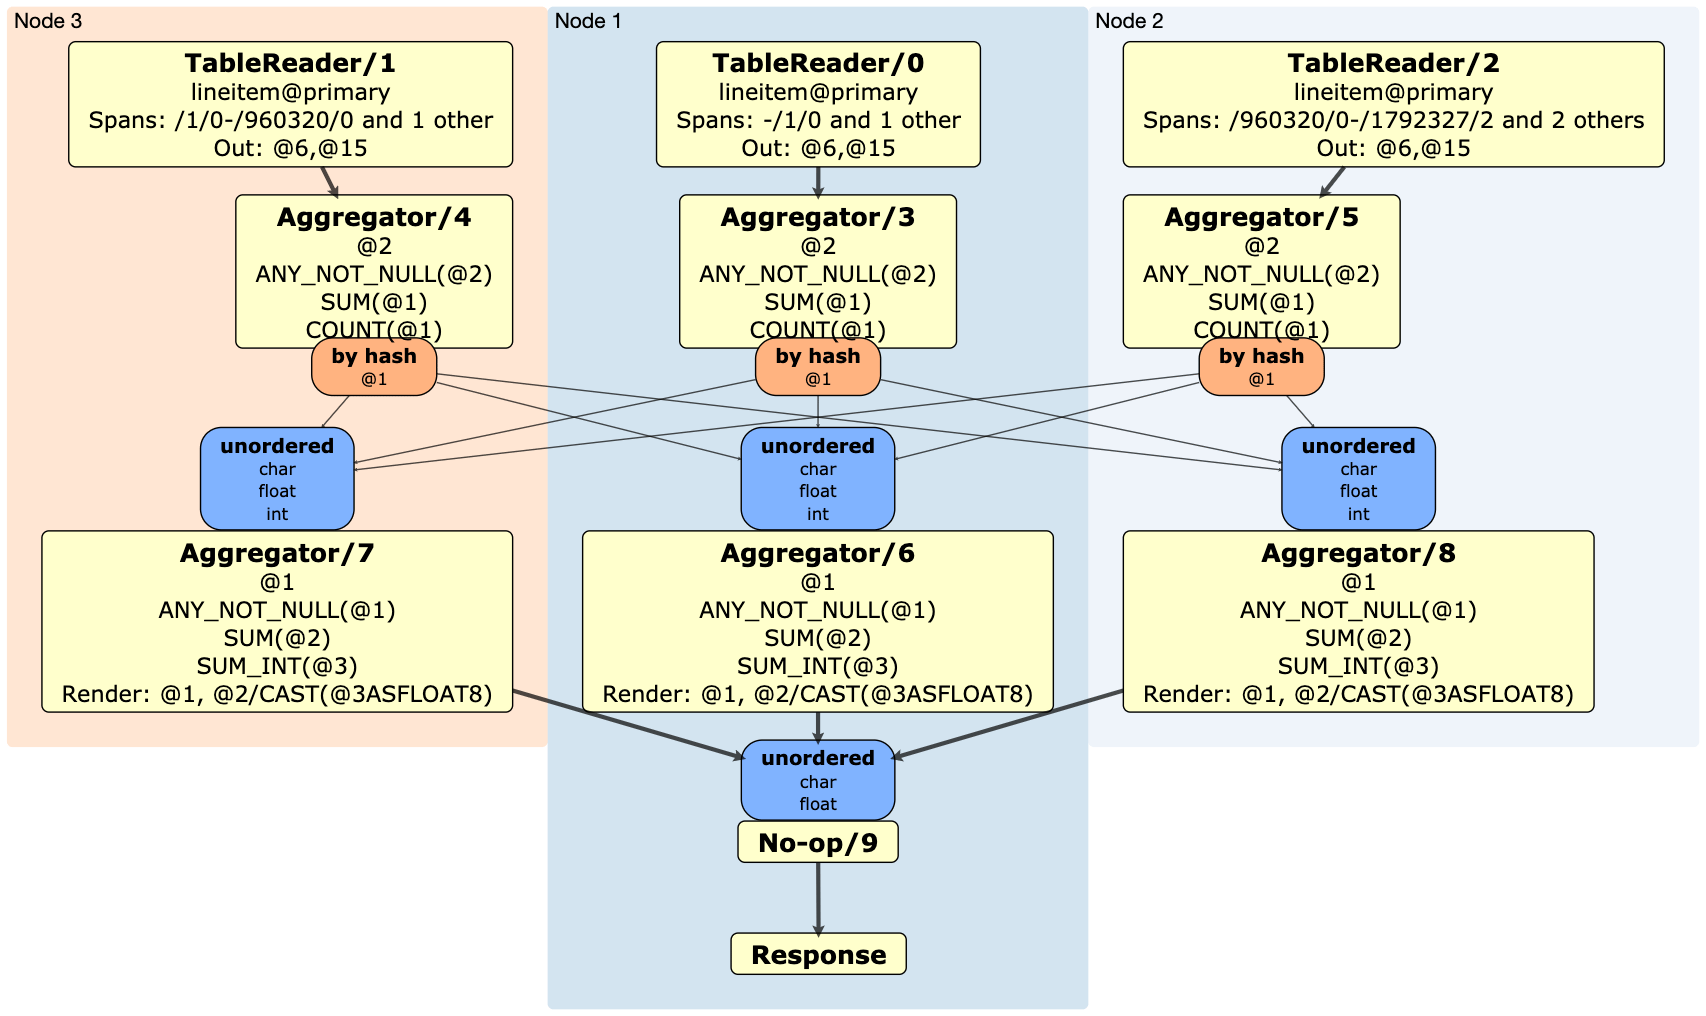 ### Find the indexes and key ranges a query uses
You can use `EXPLAIN` to understand which indexes and key ranges queries use, which can help you ensure a query isn't performing a full table scan.
```sql theme={"theme":{"light":"catppuccin-mocha","dark":"catppuccin-mocha"}}
CREATE TABLE kv (k INT PRIMARY KEY, v INT);
```
Because column `v` is not indexed, queries filtering on it alone scan the entire table:
```sql theme={"theme":{"light":"catppuccin-mocha","dark":"catppuccin-mocha"}}
EXPLAIN SELECT * FROM kv WHERE v BETWEEN 4 AND 5;
```
```
info
-----------------------------------
distribution: full
vectorized: true
• filter
│ filter: (v >= 4) AND (v <= 5)
│
└── • scan
missing stats
table: kv@kv_pkey
spans: FULL SCAN
(10 rows)
Time: 50ms total (execution 50ms / network 0ms)
```
You can disable statement plans that perform full table scans with the `disallow_full_table_scans` session variable.
When `disallow_full_table_scans=on`, attempting to execute a query with a plan that includes a full table scan will return an error:
```sql theme={"theme":{"light":"catppuccin-mocha","dark":"catppuccin-mocha"}}
SET disallow_full_table_scans=on;
```
```sql theme={"theme":{"light":"catppuccin-mocha","dark":"catppuccin-mocha"}}
SELECT * FROM kv WHERE v BETWEEN 4 AND 5;
```
```
ERROR: query `SELECT * FROM kv WHERE v BETWEEN 4 AND 5` contains a full table/index scan which is explicitly disallowed
SQLSTATE: P0003
HINT: try overriding the `disallow_full_table_scans` cluster/session setting
```
If there were an index on `v`, CockroachDB would be able to avoid scanning the entire table:
```sql theme={"theme":{"light":"catppuccin-mocha","dark":"catppuccin-mocha"}}
CREATE INDEX v ON kv (v);
```
```sql theme={"theme":{"light":"catppuccin-mocha","dark":"catppuccin-mocha"}}
EXPLAIN SELECT * FROM kv WHERE v BETWEEN 4 AND 5;
```
```
info
--------------------------------------------------------------------------------
distribution: local
vectorized: true
• scan
estimated row count: 1 (100% of the table; stats collected 11 seconds ago)
table: kv@v
spans: [/4 - /5]
(7 rows)
Time: 1ms total (execution 1ms / network 0ms)
```
Now only part of the index `v` is getting scanned, specifically the key range starting at (and including) 4 and stopping before 6. This statement plan is not distributed across nodes on the cluster.
### Find out if a statement is using `SELECT FOR UPDATE` locking
CockroachDB has support for ordering transactions by controlling concurrent access to one or more rows of a table using locks. `SELECT FOR UPDATE` locking can result in improved performance for contended operations. It applies to the following statements:
* `SELECT FOR UPDATE`
* `UPDATE`
Suppose you have a table of key-value pairs:
```sql theme={"theme":{"light":"catppuccin-mocha","dark":"catppuccin-mocha"}}
CREATE TABLE IF NOT EXISTS kv (k INT PRIMARY KEY, v INT);
UPSERT INTO kv (k, v) VALUES (1, 5), (2, 10), (3, 15);
```
You can use `EXPLAIN` to determine whether the following `UPDATE` is using `SELECT FOR UPDATE` locking.
```sql theme={"theme":{"light":"catppuccin-mocha","dark":"catppuccin-mocha"}}
EXPLAIN UPDATE kv SET v = 100 WHERE k = 1;
```
The following output contains a `locking strength` field, which means that `SELECT FOR UPDATE` locking is being used. If the `locking strength` field does not appear, the statement is not using `SELECT FOR UPDATE` locking.
```
info
------------------------------------------
distribution: local
vectorized: true
• update
│ table: kv
│ set: v
│ auto commit
│
└── • render
│
└── • scan
missing stats
table: kv@kv_pkey
spans: [/1 - /1]
locking strength: for update
(15 rows)
Time: 1ms total (execution 1ms / network 0ms)
```
By default, `SELECT FOR UPDATE` locking is enabled for the initial row scan of `UPDATE` and `UPSERT` statements. To disable it, toggle the `enable_implicit_select_for_update` session setting.
## See also
* `ALTER TABLE`
* `ALTER SEQUENCE`
* `BACKUP`
* `CANCEL JOB`
* `CREATE DATABASE`
* `CREATE STATISTICS`
* `DROP DATABASE`
* `EXECUTE`
* `EXPLAIN ANALYZE`
* Indexes
* `INSERT`
* `PAUSE JOB`
* `RESET`
* `RESTORE`
* `RESUME JOB`
* `SELECT`
* Selection Queries
* `SET`
* `SET CLUSTER SETTING`
* `SHOW COLUMNS`
* `UPDATE`
* `UPSERT`
### Find the indexes and key ranges a query uses
You can use `EXPLAIN` to understand which indexes and key ranges queries use, which can help you ensure a query isn't performing a full table scan.
```sql theme={"theme":{"light":"catppuccin-mocha","dark":"catppuccin-mocha"}}
CREATE TABLE kv (k INT PRIMARY KEY, v INT);
```
Because column `v` is not indexed, queries filtering on it alone scan the entire table:
```sql theme={"theme":{"light":"catppuccin-mocha","dark":"catppuccin-mocha"}}
EXPLAIN SELECT * FROM kv WHERE v BETWEEN 4 AND 5;
```
```
info
-----------------------------------
distribution: full
vectorized: true
• filter
│ filter: (v >= 4) AND (v <= 5)
│
└── • scan
missing stats
table: kv@kv_pkey
spans: FULL SCAN
(10 rows)
Time: 50ms total (execution 50ms / network 0ms)
```
You can disable statement plans that perform full table scans with the `disallow_full_table_scans` session variable.
When `disallow_full_table_scans=on`, attempting to execute a query with a plan that includes a full table scan will return an error:
```sql theme={"theme":{"light":"catppuccin-mocha","dark":"catppuccin-mocha"}}
SET disallow_full_table_scans=on;
```
```sql theme={"theme":{"light":"catppuccin-mocha","dark":"catppuccin-mocha"}}
SELECT * FROM kv WHERE v BETWEEN 4 AND 5;
```
```
ERROR: query `SELECT * FROM kv WHERE v BETWEEN 4 AND 5` contains a full table/index scan which is explicitly disallowed
SQLSTATE: P0003
HINT: try overriding the `disallow_full_table_scans` cluster/session setting
```
If there were an index on `v`, CockroachDB would be able to avoid scanning the entire table:
```sql theme={"theme":{"light":"catppuccin-mocha","dark":"catppuccin-mocha"}}
CREATE INDEX v ON kv (v);
```
```sql theme={"theme":{"light":"catppuccin-mocha","dark":"catppuccin-mocha"}}
EXPLAIN SELECT * FROM kv WHERE v BETWEEN 4 AND 5;
```
```
info
--------------------------------------------------------------------------------
distribution: local
vectorized: true
• scan
estimated row count: 1 (100% of the table; stats collected 11 seconds ago)
table: kv@v
spans: [/4 - /5]
(7 rows)
Time: 1ms total (execution 1ms / network 0ms)
```
Now only part of the index `v` is getting scanned, specifically the key range starting at (and including) 4 and stopping before 6. This statement plan is not distributed across nodes on the cluster.
### Find out if a statement is using `SELECT FOR UPDATE` locking
CockroachDB has support for ordering transactions by controlling concurrent access to one or more rows of a table using locks. `SELECT FOR UPDATE` locking can result in improved performance for contended operations. It applies to the following statements:
* `SELECT FOR UPDATE`
* `UPDATE`
Suppose you have a table of key-value pairs:
```sql theme={"theme":{"light":"catppuccin-mocha","dark":"catppuccin-mocha"}}
CREATE TABLE IF NOT EXISTS kv (k INT PRIMARY KEY, v INT);
UPSERT INTO kv (k, v) VALUES (1, 5), (2, 10), (3, 15);
```
You can use `EXPLAIN` to determine whether the following `UPDATE` is using `SELECT FOR UPDATE` locking.
```sql theme={"theme":{"light":"catppuccin-mocha","dark":"catppuccin-mocha"}}
EXPLAIN UPDATE kv SET v = 100 WHERE k = 1;
```
The following output contains a `locking strength` field, which means that `SELECT FOR UPDATE` locking is being used. If the `locking strength` field does not appear, the statement is not using `SELECT FOR UPDATE` locking.
```
info
------------------------------------------
distribution: local
vectorized: true
• update
│ table: kv
│ set: v
│ auto commit
│
└── • render
│
└── • scan
missing stats
table: kv@kv_pkey
spans: [/1 - /1]
locking strength: for update
(15 rows)
Time: 1ms total (execution 1ms / network 0ms)
```
By default, `SELECT FOR UPDATE` locking is enabled for the initial row scan of `UPDATE` and `UPSERT` statements. To disable it, toggle the `enable_implicit_select_for_update` session setting.
## See also
* `ALTER TABLE`
* `ALTER SEQUENCE`
* `BACKUP`
* `CANCEL JOB`
* `CREATE DATABASE`
* `CREATE STATISTICS`
* `DROP DATABASE`
* `EXECUTE`
* `EXPLAIN ANALYZE`
* Indexes
* `INSERT`
* `PAUSE JOB`
* `RESET`
* `RESTORE`
* `RESUME JOB`
* `SELECT`
* Selection Queries
* `SET`
* `SET CLUSTER SETTING`
* `SHOW COLUMNS`
* `UPDATE`
* `UPSERT`