> ## Documentation Index
> Fetch the complete documentation index at: https://cockroachlabs.mintlify.site/llms.txt
> Use this file to discover all available pages before exploring further.
# Troubleshoot SQL Statements
export const InternalLink = ({version, path = "", children, ...props}) => {
let detectedVersion = version || "stable";
if (typeof window !== 'undefined' && !version) {
const match = window.location.pathname.match(/\/docs\/([^/]+)/);
if (match) {
detectedVersion = match[1];
}
}
const normalizedPath = path.startsWith("/") ? path.slice(1) : path;
return
{children}
;
};
If a SQL statement returns an unexpected result or takes longer than expected to process, this page will help you troubleshoot the issue.
For a developer-centric overview of optimizing SQL statement performance, see Optimize Statement Performance Overview.
## Query issues
### Hanging or stuck queries
When you experience a hanging or stuck query and the cluster is healthy (i.e., no unavailable ranges, network partitions, etc), the cause could be a long-running transaction holding write intents or locking reads on the same rows as your query.
Such long-running queries can hold locks for (practically) unlimited durations. If your query tries to access those rows, it must wait for that transaction to complete (by committing or rolling back) before it can make progress. Until the transaction is committed or rolled back, the chances of concurrent transactions internally retrying and throwing a retry error increase.
Refer to the performance tuning recipe for identifying and unblocking a waiting transaction.
If you experience this issue on a CockroachDB Standard or Basic cluster, your cluster may be throttled or disabled because you've reached your monthly resource limits.
### Identify slow queries
You can identify high-latency SQL statements on the **Insights** or **Statements** pages in the DB Console. If these graphs reveal latency spikes, CPU usage spikes, or slow requests, these might indicate slow queries in your cluster.
You can also enable the slow query log to log all queries whose latency exceeds a configured threshold, as well as queries that perform a full table or index scan.
You can collect richer diagnostics of a high-latency statement by creating a diagnostics bundle when a statement fingerprint exceeds a certain latency. To identify slow transactions in an active workload, you can [selectively log traces of transactions](#log-traces-for-transactions) that exceed a configured latency threshold.
If you find queries that are consuming too much memory, cancel the queries to free up memory usage. For information on optimizing query performance, see SQL Performance Best Practices.
### Visualize statement traces in Jaeger
You can look more closely at the behavior of a statement by visualizing a statement trace in [Jaeger](https://www.jaegertracing.io/). A statement trace contains messages and timing information from all nodes involved in the execution.
#### Run Jaeger
1. Start Jaeger:
```shell theme={"theme":{"light":"catppuccin-mocha","dark":"catppuccin-mocha"}}
docker run -d --name jaeger -p 6831:6831/udp -p 16686:16686 jaegertracing/all-in-one:latest
```
This runs the latest version of Jaeger, and forwards two ports to the container. `6831` is the trace ingestion port, `16686` is the UI port. By default, Jaeger will store all received traces in memory.
#### Import a trace from a diagnostics bundle into Jaeger
1. Activate statement diagnostics on the DB Console Statements Page or run `EXPLAIN ANALYZE (DEBUG)` to obtain a diagnostics bundle for the statement.
2. Go to [`http://localhost:16686`](http://localhost:16686/).
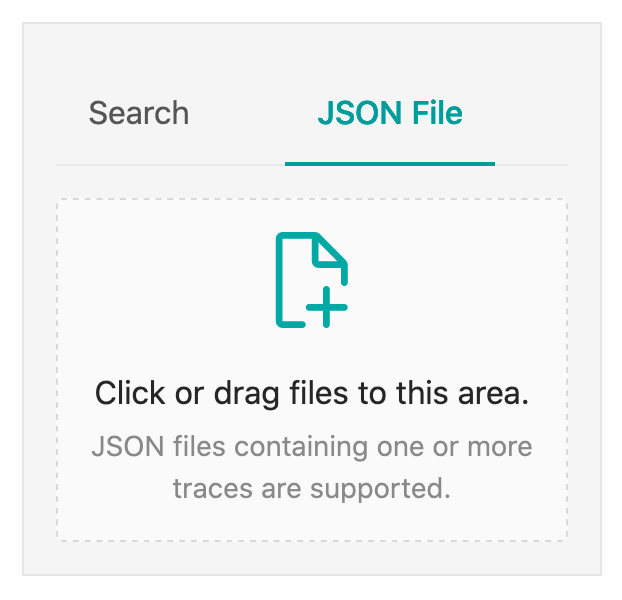
3. Click **JSON File** in the Jaeger UI and upload `trace-jaeger.json` from the diagnostics bundle. The trace will appear in the list on the right.
 4. Click the trace to view its details. It is visualized as a collection of spans with timestamps. These may include operations executed by different nodes.
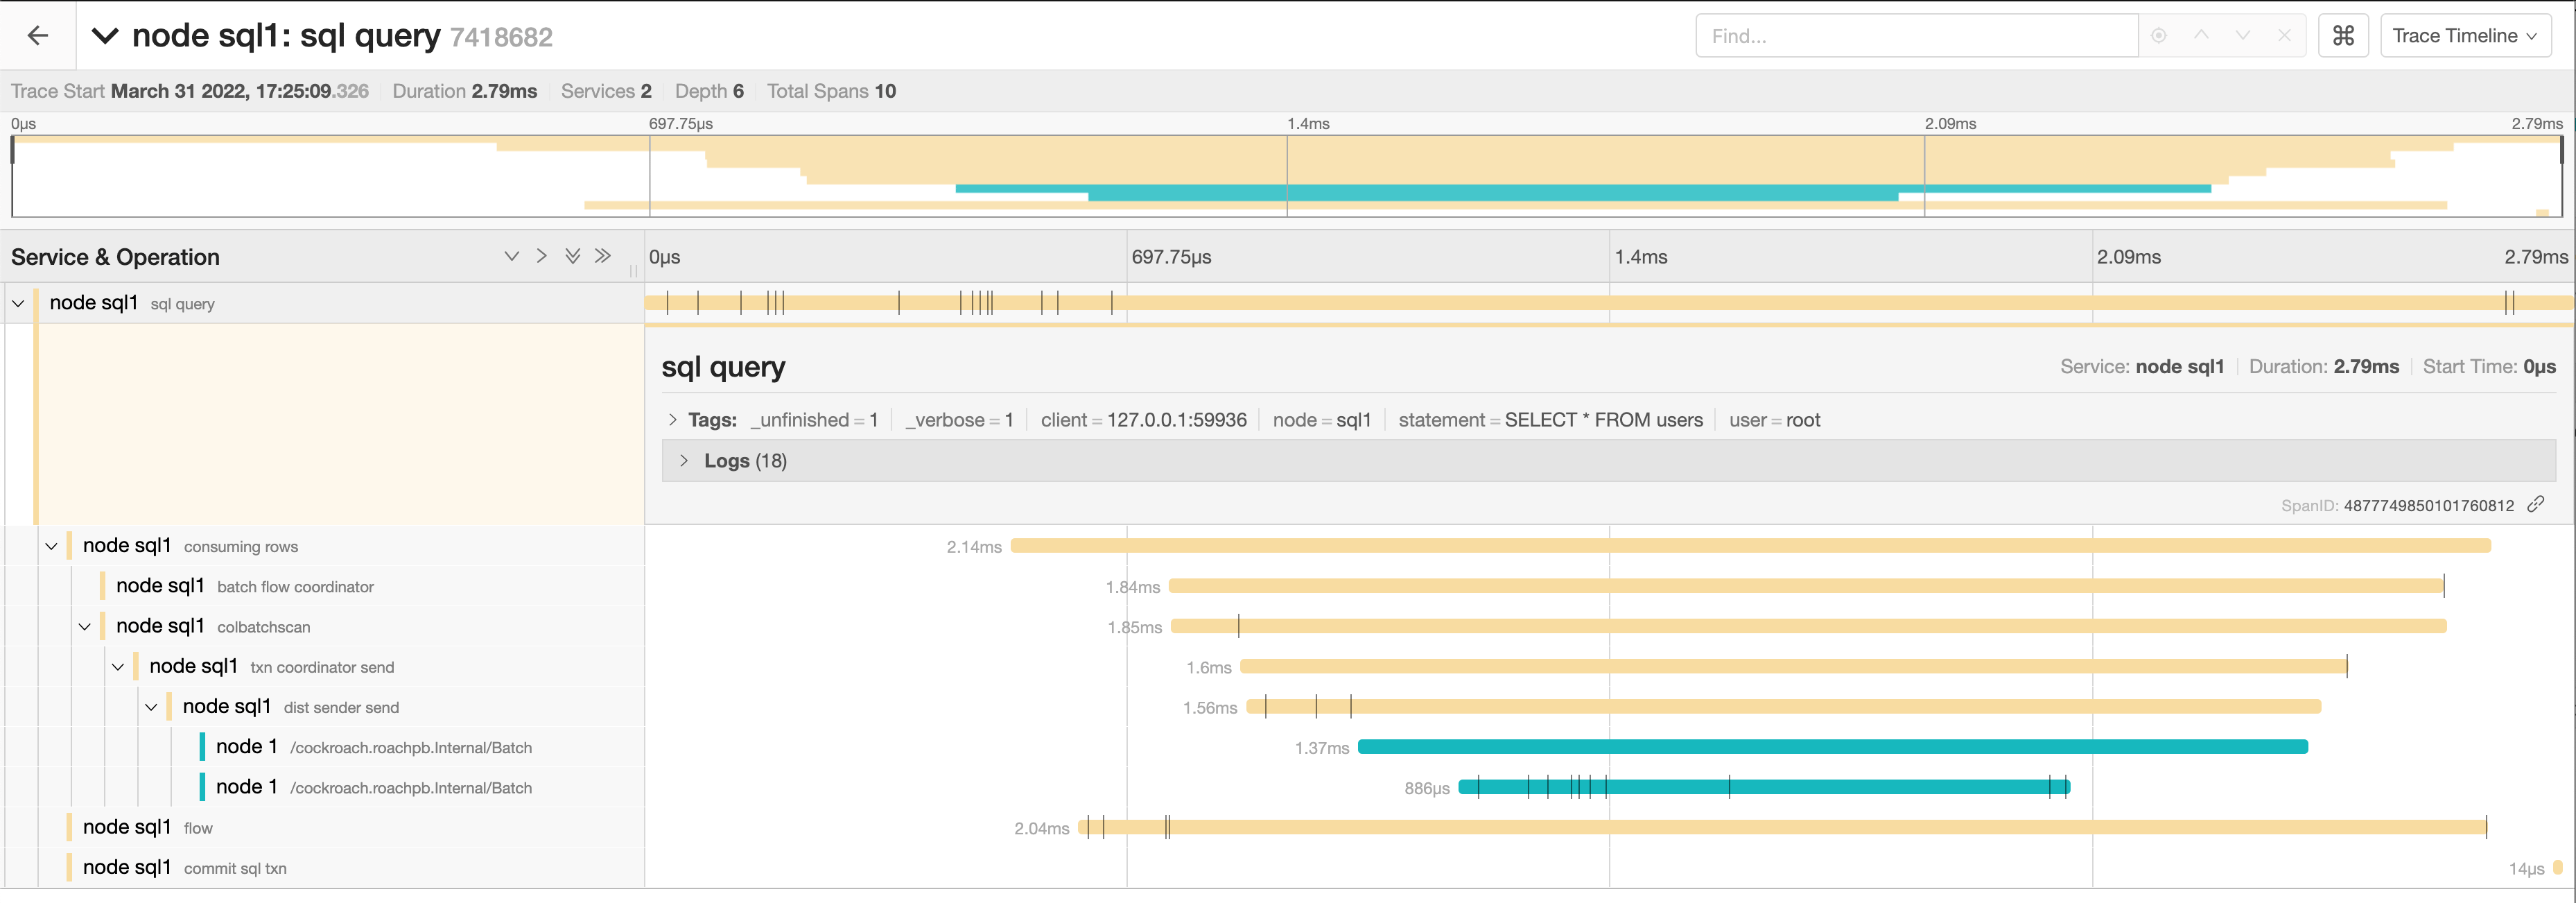 The full timeline displays the execution time and execution phases for the statement.
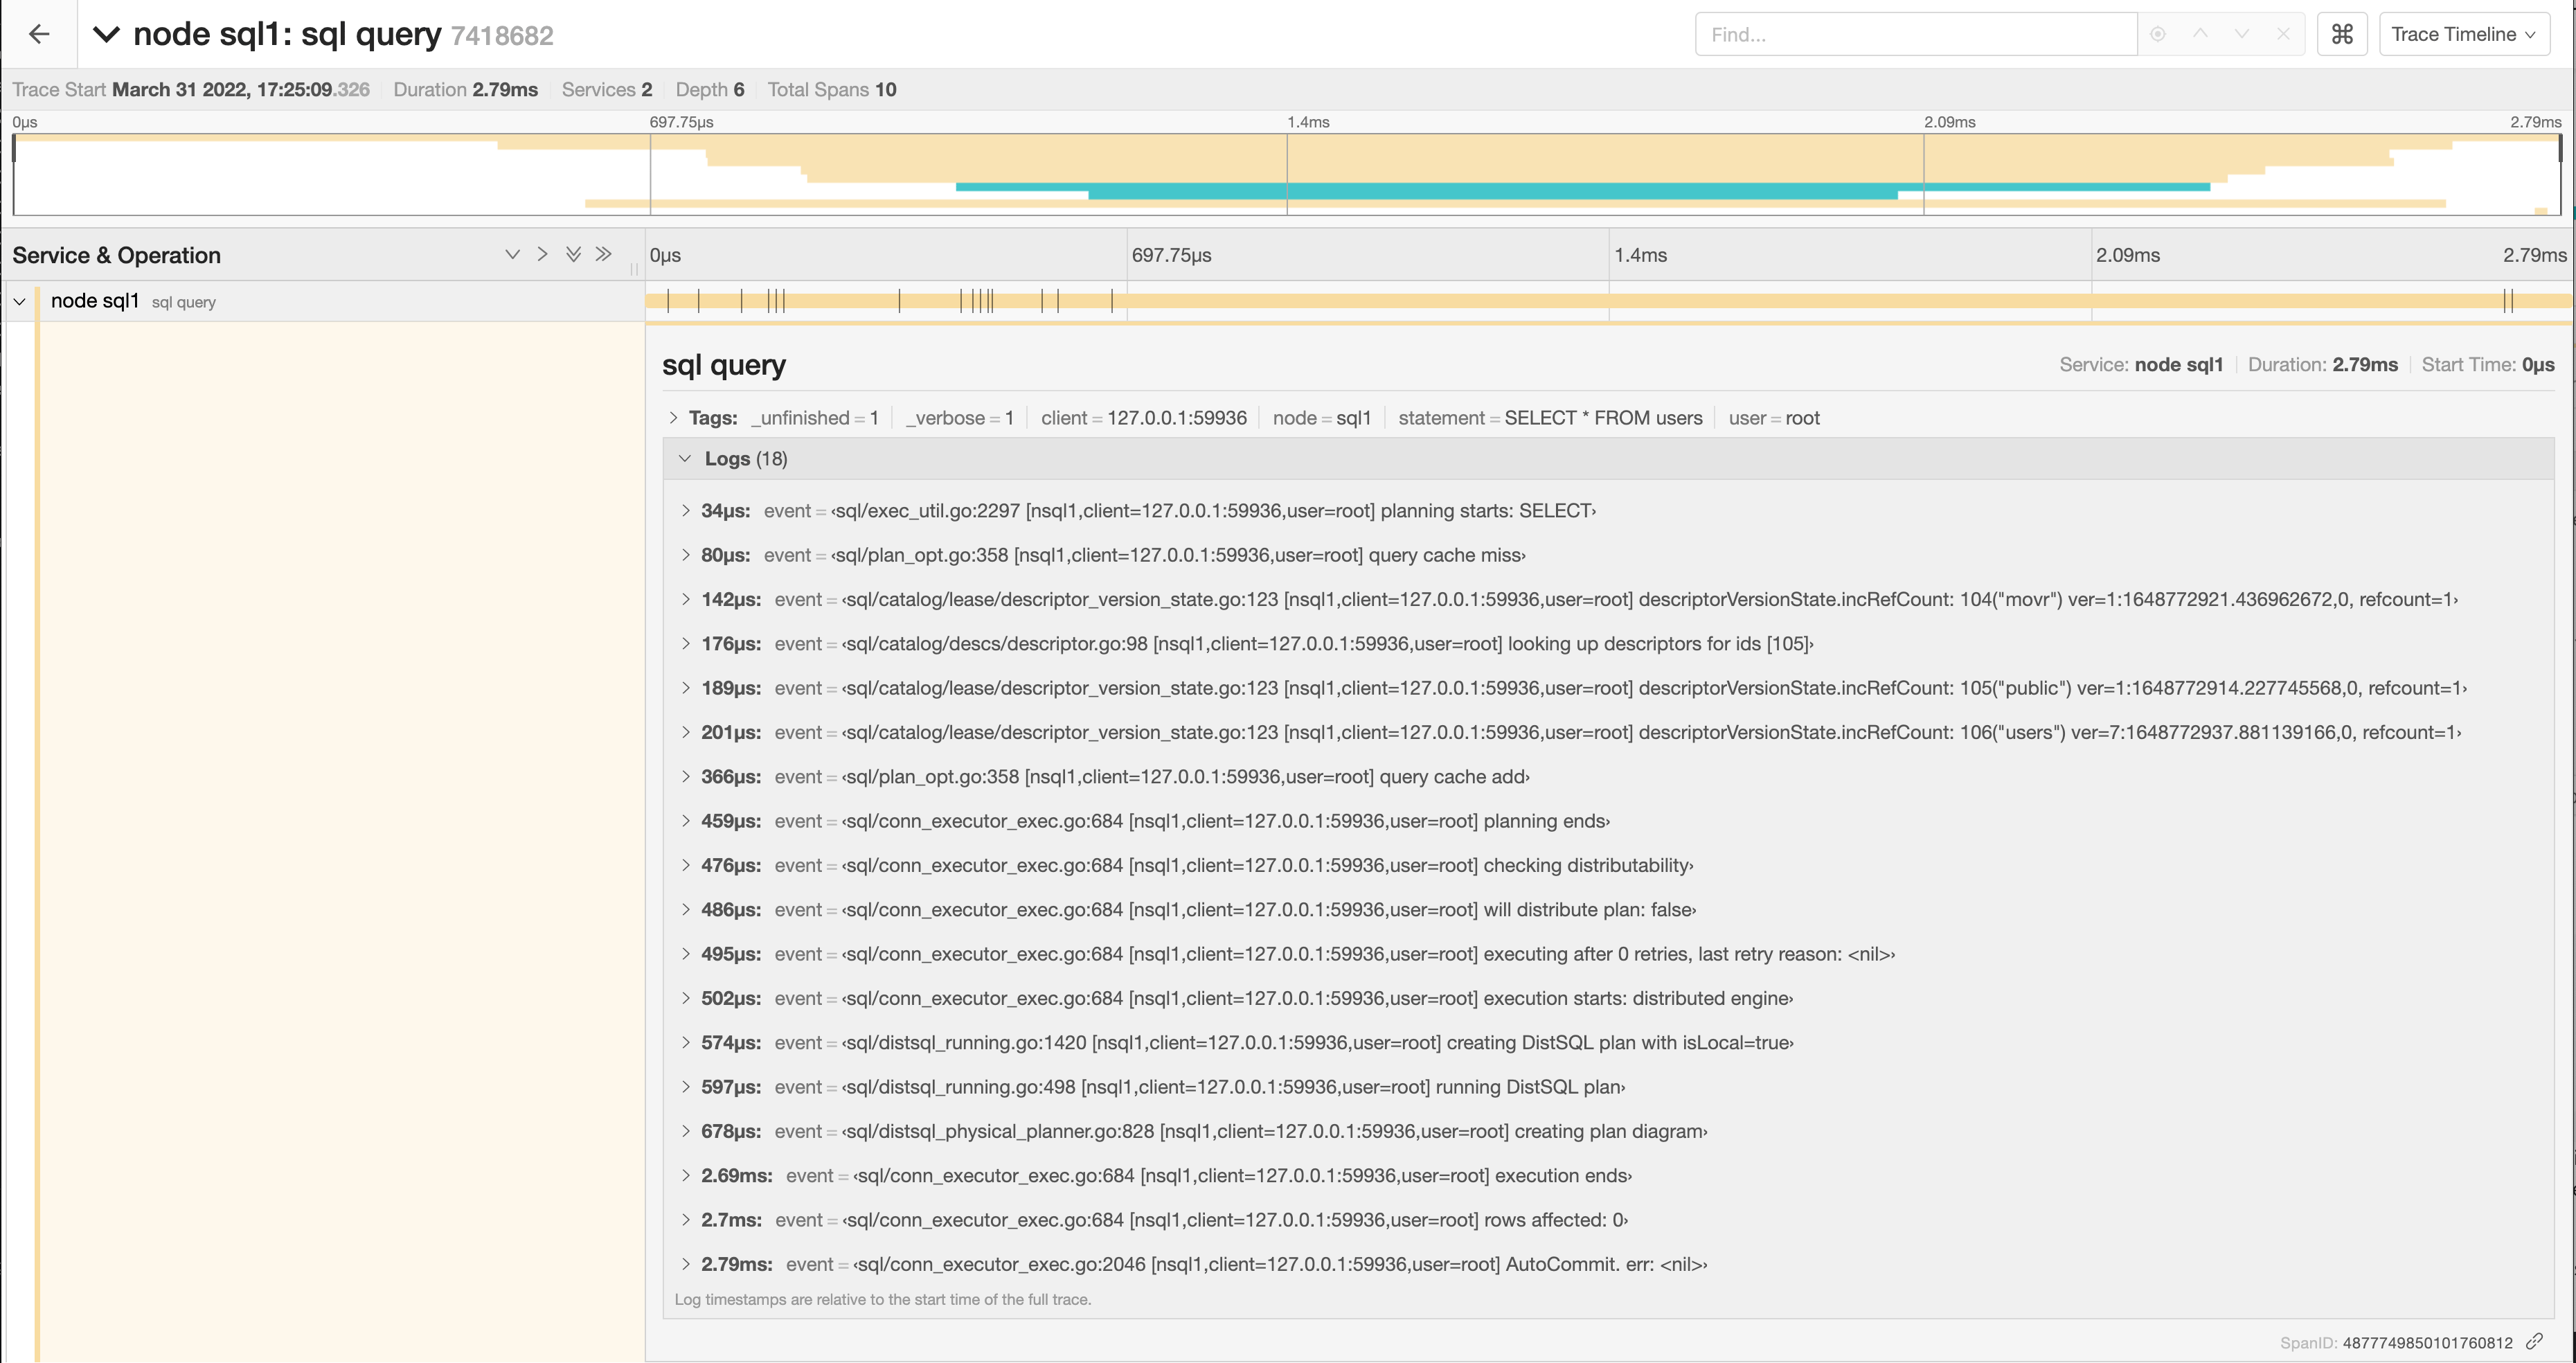
5. Click a span to view details for that span and log messages.
The full timeline displays the execution time and execution phases for the statement.
5. Click a span to view details for that span and log messages.
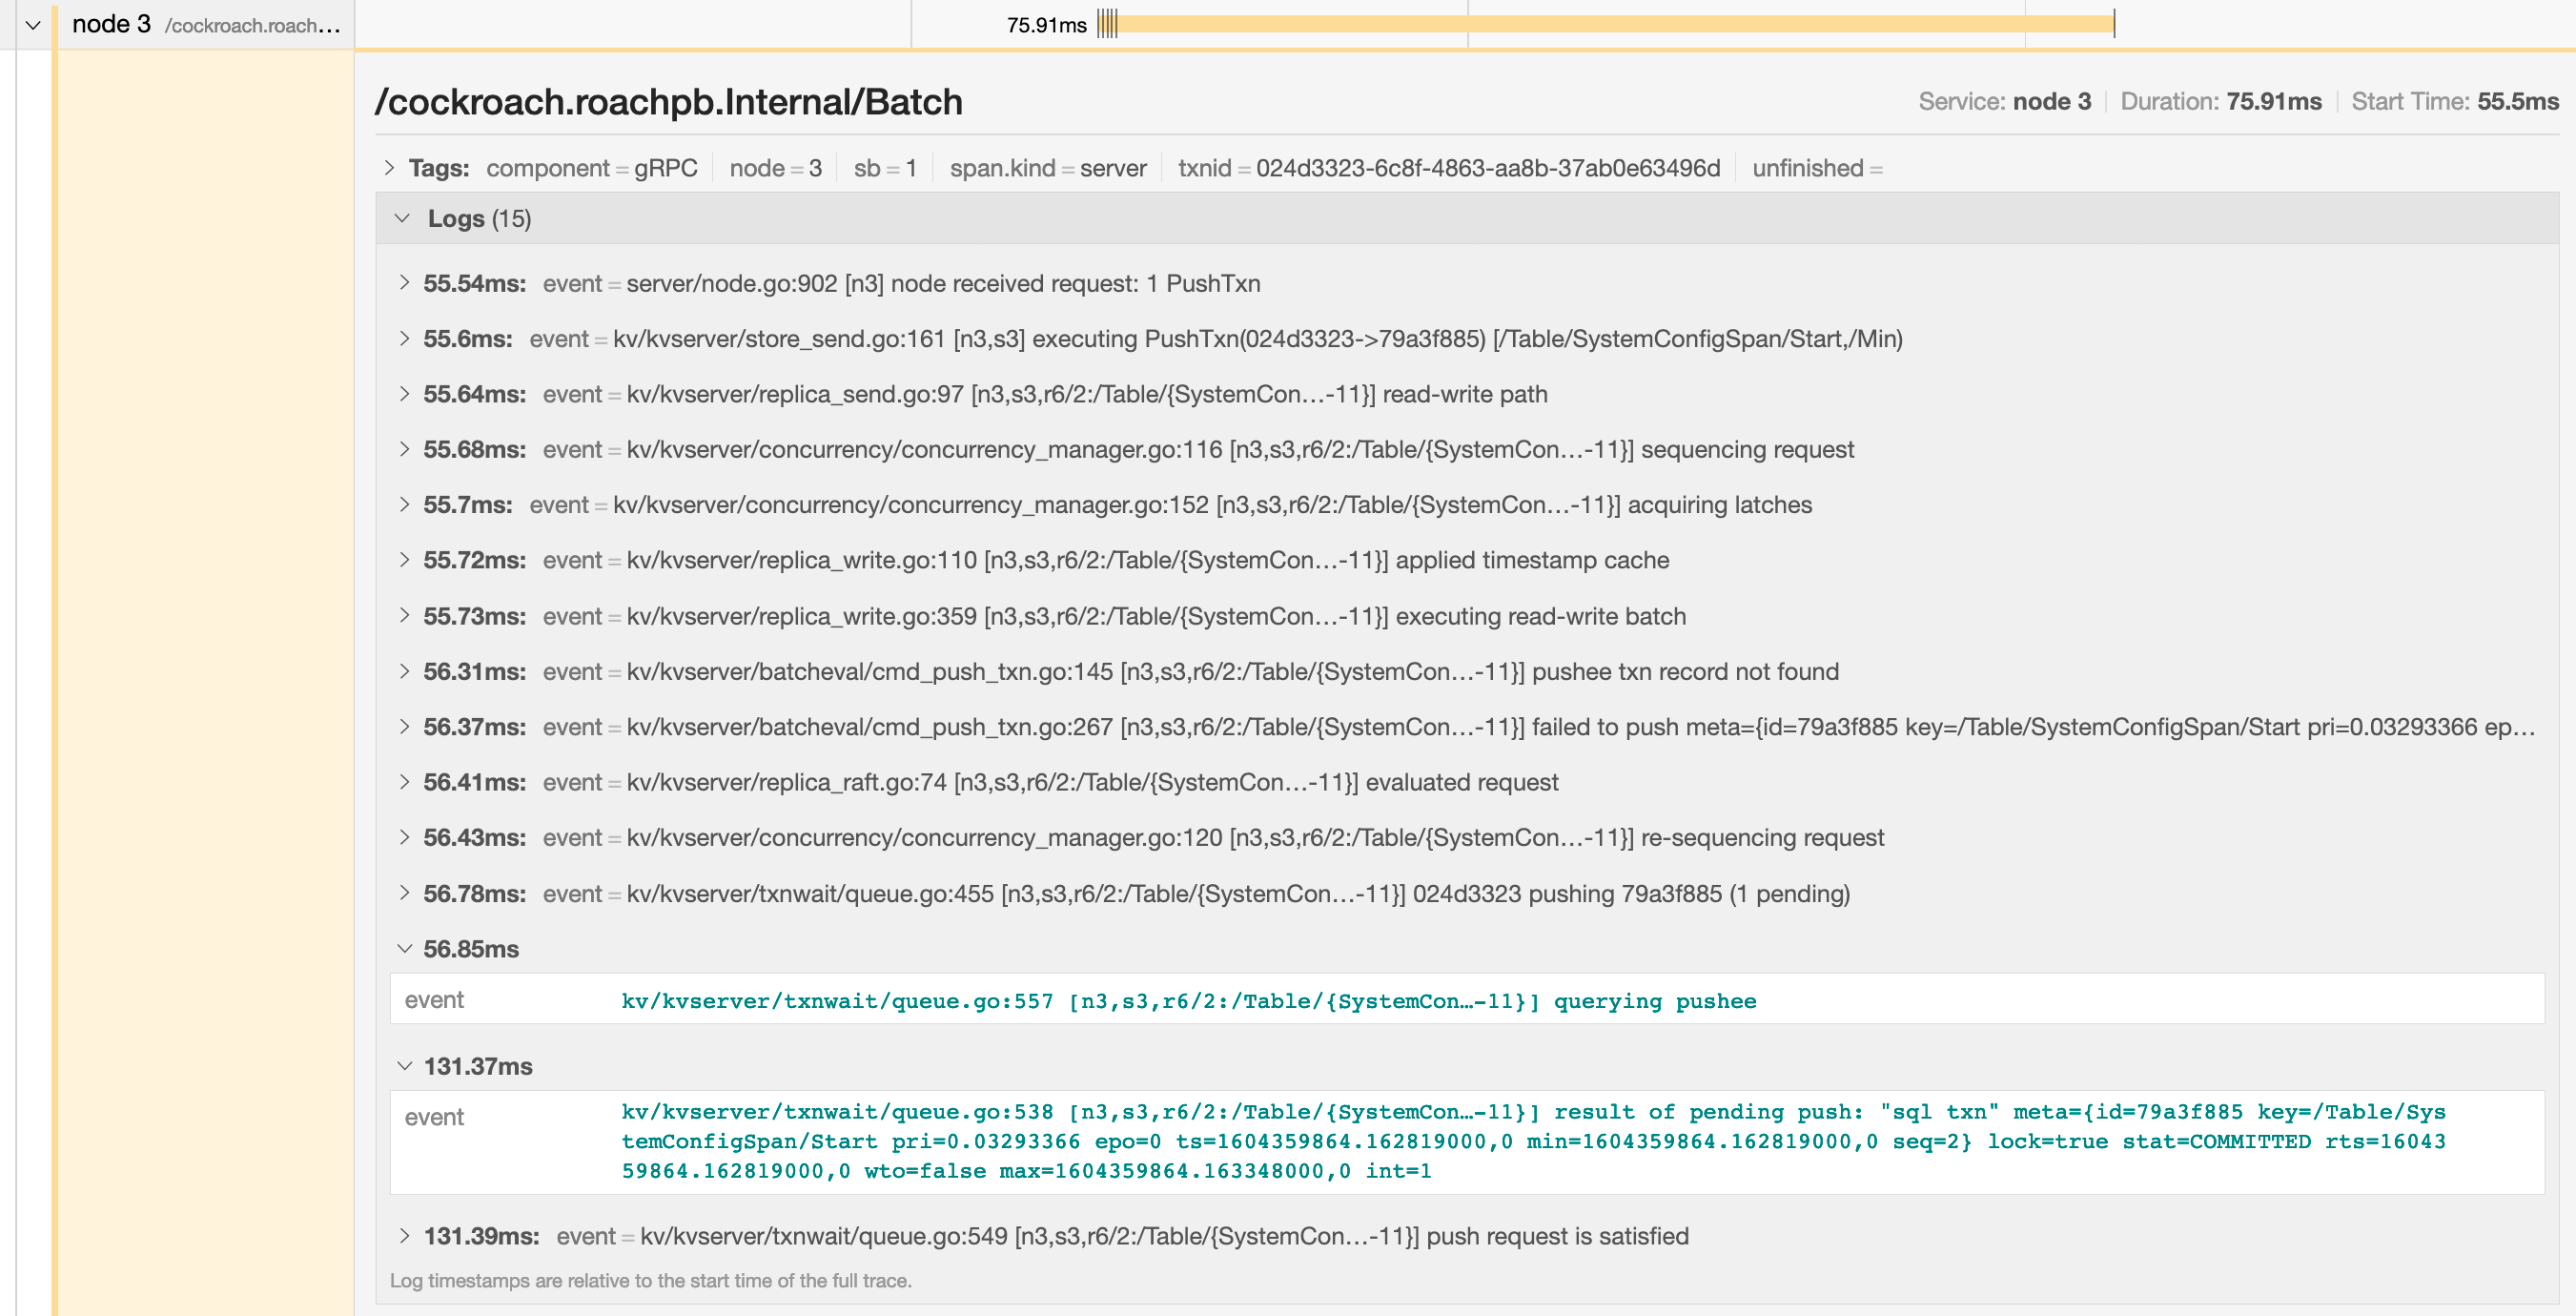
 6. You can troubleshoot transaction contention, for example, by gathering diagnostics on statements with high latency and looking through the log messages in `trace-jaeger.json` for jumps in latency.
In the following example, the trace shows that there is significant latency between a push attempt on a transaction that is holding a lock (56.85ms) and that transaction being committed (131.37ms).
6. You can troubleshoot transaction contention, for example, by gathering diagnostics on statements with high latency and looking through the log messages in `trace-jaeger.json` for jumps in latency.
In the following example, the trace shows that there is significant latency between a push attempt on a transaction that is holding a lock (56.85ms) and that transaction being committed (131.37ms).
 #### Visualize traces sent directly from CockroachDB
This example shows how to configure CockroachDB to route all traces to Jaeger. For details on sending traces from CockroachDB to Jaeger and other trace collectors, see [Configure CockroachDB to send traces to a third-party trace collector](#configure-cockroachdb-to-send-traces-to-a-third-party-trace-collector).
Enabling full tracing is expensive both in terms of CPU usage and memory footprint, and is not suitable for high throughput production environments.
1. Run CockroachDB and set the Jaeger agent configuration:
```sql theme={"theme":{"light":"catppuccin-mocha","dark":"catppuccin-mocha"}}
SET CLUSTER SETTING trace.jaeger.agent='localhost:6831'
```
2. Go to [`http://localhost:16686`](http://localhost:16686/).
3. In the Service field, select **CockroachDB**.
#### Visualize traces sent directly from CockroachDB
This example shows how to configure CockroachDB to route all traces to Jaeger. For details on sending traces from CockroachDB to Jaeger and other trace collectors, see [Configure CockroachDB to send traces to a third-party trace collector](#configure-cockroachdb-to-send-traces-to-a-third-party-trace-collector).
Enabling full tracing is expensive both in terms of CPU usage and memory footprint, and is not suitable for high throughput production environments.
1. Run CockroachDB and set the Jaeger agent configuration:
```sql theme={"theme":{"light":"catppuccin-mocha","dark":"catppuccin-mocha"}}
SET CLUSTER SETTING trace.jaeger.agent='localhost:6831'
```
2. Go to [`http://localhost:16686`](http://localhost:16686/).
3. In the Service field, select **CockroachDB**.
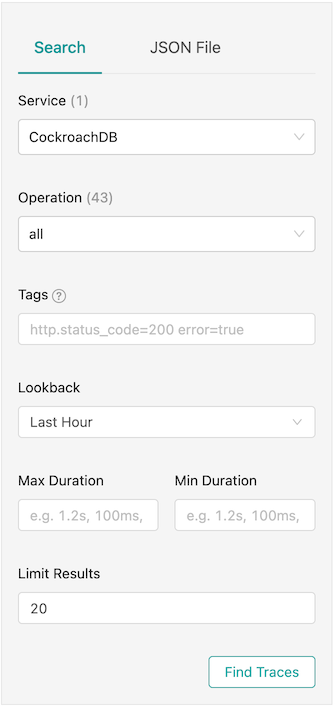 4. Click **Find Traces**.
Instead of searching through log messages in an unstructured fashion, the logs are now graphed in a tree format based on how the contexts were passed around. This also traverses machine boundaries so you don't have to look at different flat `.log` files to correlate events.
Jaeger's memory storage works well for small use cases, but can result in out of memory errors when collecting many traces over a long period of time. Jaeger also supports disk-backed local storage using [Badger](https://www.jaegertracing.io/docs/1.32/deployment#badger---local-storage). To use this, start Jaeger by running the following Docker command:
```shell theme={"theme":{"light":"catppuccin-mocha","dark":"catppuccin-mocha"}}
docker run -d --name jaeger \
-e SPAN_STORAGE_TYPE=badger -e BADGER_EPHEMERAL=false \
-e BADGER_DIRECTORY_VALUE=/badger/data -e BADGER_DIRECTORY_KEY=/badger/key \
-v /mnt/data1/jaeger:/badger \
-p 6831:6831/udp -p 16686:16686 jaegertracing/all-in-one:latest
```
### Log traces for transactions
CockroachDB allows you to trace transactions to help troubleshoot performance issues. Tracing is controlled through the following cluster settings that govern when a transaction trace is captured and emitted.
#### Trace sampling and emission
To enable tracing for a subset of transactions and emit relevant traces to the `SQL_EXEC` logging channel, configure the following cluster settings:
* `sql.trace.txn.sample_rate`: Specifies the probability (between `0.0` and `1.0` ) that a given transaction will have tracing enabled. A value of `0.01` means that approximately 1% of transactions are traced. The default is `1`, which means 100% of transactions are sampled.
* `sql.trace.txn.enable_threshold`: Specifies a duration threshold. A trace is emitted only if a sampled transaction's execution time exceeds this value. When set to `0` (default), tracing is disabled regardless of whether the value of `sql.trace.txn.sample_rate` is greater than `0`.
To emit a trace to the logs, the following conditions must be met:
1. The transaction is selected based on the sampling probability.
2. Its execution duration exceeds the configured threshold.
This approach minimizes overhead by tracing a fraction of the workload and emitting traces only for potentially relevant transactions.
Additional cluster settings that control trace emission are:
* `sql.trace.txn.include_internal.enabled`: Enables inclusion of internal transactions in probabilistic transaction tracing and latency-based logging. This setting is enabled by default. Set this to `false` to omit internal transactions and reduce noise when debugging user workloads.
* `sql.trace.txn.jaeger_json_output.enabled`: Enables output of transaction traces in Jaeger-compatible JSON format for easier ingestion by observability tools. This setting is disabled by default.
#### Trace configuration example
To configure the trace sampling probability and duration, set the following cluster settings:
```sql theme={"theme":{"light":"catppuccin-mocha","dark":"catppuccin-mocha"}}
-- Enable trace sampling at a rate of 1%
SET CLUSTER SETTING sql.trace.txn.sample_rate = 0.01;
-- Emit traces for sampled transactions that run longer than 1s
SET CLUSTER SETTING sql.trace.txn.enable_threshold = '1s';
```
With this configuration, approximately 1% of transactions are traced, and only those running longer than 1s will have their traces written to the logs. In the `SQL_EXEC` log, a line similar to the following precedes the trace:
```text theme={"theme":{"light":"catppuccin-mocha","dark":"catppuccin-mocha"}}
SQL txn took 2.004362083s, exceeding threshold of 1s:
```
### Queries are always slow
If you have consistently slow queries in your cluster, use the Statement Fingerprint page to drill down to an individual statement and collect diagnostics for the statement. A diagnostics bundle contains a record of transaction events across nodes for the SQL statement.
You can also use an `EXPLAIN ANALYZE` statement, which executes a SQL query and returns a physical query plan with execution statistics. You can use query plans to troubleshoot slow queries by indicating where time is being spent, how long a processor (i.e., a component that takes streams of input rows and processes them according to a specification) is not doing work, etc.
Cockroach Labs recommends sending either the diagnostics bundle (preferred) or the `EXPLAIN ANALYZE` output to our support team for analysis.
### Queries are sometimes slow
If the query performance is irregular:
1. Run `SHOW TRACE FOR SESSION` for the query twice: once when the query is performing as expected and once when the query is slow.
2. Contact support to help analyze the outputs of the `SHOW TRACE` command.
### `SELECT` statements are slow
The common reasons for a sub-optimal `SELECT` performance are inefficient scans, full scans, and incorrect use of indexes. To improve the performance of `SELECT` statements, refer to the following documents:
* Table scan best practices
* Indexes best practices
### `SELECT` statements with `GROUP BY` columns are slow
Suppose you have a slow selection query that
* Has a `GROUP BY` clause.
* Uses an index that has a `STORING` clause.
* Where some or all of the columns in the query's `GROUP BY` clause are part of the index's `STORING` clause and are **not** index key columns.
For example:
```sql theme={"theme":{"light":"catppuccin-mocha","dark":"catppuccin-mocha"}}
SELECT
cnt, organization, concat(os, '-', version) AS bucket
FROM
(
SELECT
count(1)::FLOAT8 AS cnt, organization, os, version
FROM
nodes
WHERE
lastseen > ($1)::TIMESTAMPTZ AND lastseen <= ($2)::TIMESTAMPTZ
GROUP BY
organization, os, version
)
Arguments:
$1: '2021-07-27 13:22:09.000058Z'
$2: '2021-10-25 13:22:09.000058Z'
```
The columns in the `GROUP BY` clause are `organization`, `os`, and `version`.
The query plan shows that it is using index `nodes_lastseen_organization_storing`:
```text theme={"theme":{"light":"catppuccin-mocha","dark":"catppuccin-mocha"}}
distribution full
vectorized true
render (cnt float, organization varchar, bucket string)
│ estimated row count 3760
│ render 0 (concat((os)[string], ('-')[string], (version)[string]))[string]
│ render 1 ((count_rows)[int]::FLOAT8)[float]
│ render 2 (organization)[varchar]
└── group (organization varchar, os string, version string, count_rows int)
│ estimated row count 3760
│ aggregate 0 count_rows()
│ group by organization, os, version
└── project (organization varchar, os string, version string)
└── scan (organization varchar, lastseen timestamptz, os string, version string)
estimated row count 2330245
table nodes@nodes_lastseen_organization_storing
spans /2021-07-27T13:22:09.000059Z-/2021-10-25T13:22:09.000058001Z
```
Here is the table schema for the example query:
```sql theme={"theme":{"light":"catppuccin-mocha","dark":"catppuccin-mocha"}}
CREATE TABLE public.nodes (
id VARCHAR(60) NOT NULL,
ampuuid UUID NULL,
organization VARCHAR(60) NULL,
created TIMESTAMPTZ NULL DEFAULT now():::TIMESTAMPTZ,
disabled BOOL NOT NULL DEFAULT false,
lastseen TIMESTAMPTZ NULL DEFAULT now():::TIMESTAMPTZ,
os STRING NOT NULL,
arch STRING NOT NULL,
autotags JSONB NULL,
version STRING NOT NULL DEFAULT '':::STRING,
clone BOOL NOT NULL DEFAULT false,
cloneof VARCHAR(60) NOT NULL DEFAULT '':::STRING,
endpoint_type STRING NOT NULL DEFAULT 'amp':::STRING,
ip INET NULL,
osqueryversion STRING NOT NULL DEFAULT '':::STRING,
CONSTRAINT "primary" PRIMARY KEY (id ASC),
INDEX nodes_organization_ampuuid (organization ASC, ampuuid ASC),
INDEX nodes_created_asc_organization (created ASC, organization ASC),
INDEX nodes_created_desc_organization (created DESC, organization ASC),
INDEX nodes_organization_os_version (organization ASC, os ASC, version ASC),
INDEX nodes_organization_version (organization ASC, version ASC),
INDEX nodes_lastseen_organization_storing (lastseen ASC, organization ASC) STORING (os, version),
FAMILY "primary" (id, ampuuid, organization, created, disabled, lastseen, os, arch, autotags, version, clone, cloneof, endpoint_type, ip, osqueryversion)
);
```
The `nodes_lastseen_organization_storing` index has the `GROUP BY` column `organization` as an index key column. However, the `STORING` clause includes the `GROUP BY` columns `os` and `version`.
#### Solution
Create a new secondary index that has all of the `GROUP BY` columns as key columns in the index.
```sql theme={"theme":{"light":"catppuccin-mocha","dark":"catppuccin-mocha"}}
CREATE INDEX "nodes_lastseen_organization_os_version" (lastseen, organization, os, version)
```
This index allows CockroachDB to perform a streaming `GROUP BY` rather than a hash `GROUP BY`. After you make this change, you should notice an improvement in the latency of the example query.
### `INSERT` and `UPDATE` statements are slow
Use the Statements page to identify the slow SQL statements.
Refer to the following pages to improve `INSERT` and `UPDATE` performance:
* Multi-row DML
* Bulk-Insert best practices
### Cancel running queries
See Cancel long-running queries.
### Low throughput
Throughput is affected by the disk I/O, CPU usage, and network latency. Use the DB Console to check the following metrics:
* Disk I/O: Disk IOPS in progress
* CPU usage: CPU percent
* Network latency: Network Latency
### Query runs out of memory
If your query returns the error code `SQLSTATE: 53200` with the message `ERROR: root: memory budget exceeded`, follow the guidelines in memory budget exceeded.
## Transaction retry errors
Messages with the error code `40001` and the string `restart transaction` are known as *transaction retry errors*. These indicate that a transaction failed due to contention with another concurrent or recent transaction attempting to write to the same data. The transaction needs to be retried by the client.
In most cases, the correct actions to take when encountering transaction retry errors are:
1. Under `SERIALIZABLE` isolation, update your application to support client-side retry handling when transaction retry errors are encountered. Follow the guidance for the specific error type.
2. Take steps to minimize transaction retry errors in the first place. This means reducing transaction contention overall, and increasing the likelihood that CockroachDB can automatically retry a failed transaction.
## Unsupported SQL features
CockroachDB has support for most SQL features.
Additionally, CockroachDB supports the PostgreSQL wire protocol and the majority of its syntax. This means that existing applications can often be migrated to CockroachDB without changing application code.
However, you may encounter features of SQL or the PostgreSQL dialect that are not supported by CockroachDB. For example, the following PostgreSQL features are not supported:
### `CREATE DOMAIN`
CockroachDB does not support `CREATE DOMAIN`.
### PostgreSQL range types
CockroachDB does not support PostgreSQL range types.
### Other unsupported features
* Events.
* Drop primary key.
Each table must have a primary key associated with it. You can drop and add a primary key constraint within a single transaction.
* XML functions.
* Column-level privileges.
* XA syntax.
* Creating a database from a template.
* Dropping a single partition from a table.
* Foreign data wrappers.
* Advisory Lock Functions (although some functions are defined with no-op implementations).
For more information about the differences between CockroachDB and PostgreSQL feature support, see PostgreSQL Compatibility.
For more information about the SQL standard features supported by CockroachDB, see SQL Feature Support.
## Node issues
### Single hot node
A *hot node* is one that has much higher resource usage than other nodes. To determine if you have a hot node in your cluster, access the DB Console and check the following:
* Click **Metrics** and navigate to the following graphs. Hover over each graph to see the per-node values of the metrics. If one of the nodes has a higher value, you have a hot node in your cluster.
* **Replication** dashboard > **Average Queries per Store** graph
* **Overview** dashboard > **Service Latency** graph
* **Hardware** dashboard > **CPU Percent** graph
* **SQL** dashboard > **SQL Connections** graph
* **Hardware** dashboard > **Disk IOPS in Progress** graph
* Open the **Top Ranges** page and check for ranges with significantly higher QPS on any nodes.
#### Solution
* If you have a small table that fits into one range, then only one of the nodes will be used. This is expected behavior. However, you can split your range to distribute the table across multiple nodes.
* If the SQL Connections graph shows that one node has a higher number of SQL connections and other nodes have zero connections, check if your app is set to talk to only one node.
* Check load balancer settings.
* Check for transaction contention.
* If you have a monotonically increasing index column or primary Key, then your index or primary key should be redesigned. For more information, see Unique ID best practices.
* If a range has significantly higher QPS on a node, it may indicate a hotspot that needs to be addressed. For more information, refer to Hot range.
* If you have a monotonically increasing index column or primary key, then your index or primary key should be redesigned. See Unique ID best practices for more information.
### Per-node queries per second (QPS) is high
If a cluster is not idle, it is useful to monitor the per-node queries per second. CockroachDB will automatically distribute load throughout the cluster. If one or more nodes is not performing any queries there is likely something to investigate. See `exec_success` and `exec_errors` which track operations at the KV layer and `sql_{select,insert,update,delete}_count` which track operations at the SQL layer.
### Increasing number of nodes does not improve performance
See Why would increasing the number of nodes not result in more operations per second?
### `bad connection` and `closed` responses
A response of `bad connection` or `closed` normally indicates that the node to which you are connected has terminated. You can check this by connecting to another node in the cluster and running `cockroach node status`.
Once you find the node, you can check its logs (stored in `cockroach-data/logs` by default).
Because this kind of behavior is unexpected, you should contact Support.
### Log queries executed by a specific node
If you are testing CockroachDB locally and want to log queries executed by a specific node, you can either pass a CLI flag at node startup or execute a SQL function on a running node.
Using the CLI to start a new node, use the `--vmodule` flag with the `cockroach start` command. For example, to start a single node locally and log all client-generated SQL queries it executes, run:
```shell theme={"theme":{"light":"catppuccin-mocha","dark":"catppuccin-mocha"}}
$ cockroach start --insecure --listen-addr=localhost --vmodule=exec_log=2 --join=
To log CockroachDB-generated SQL queries as well, use `--vmodule=exec_log=3`.
From the SQL prompt on a running node, execute the `crdb_internal.set_vmodule()` function:
```sql theme={"theme":{"light":"catppuccin-mocha","dark":"catppuccin-mocha"}}
> SELECT crdb_internal.set_vmodule('exec_log=2');
```
This will result in the following output:
```text theme={"theme":{"light":"catppuccin-mocha","dark":"catppuccin-mocha"}}
crdb_internal.set_vmodule
+---------------------------+
0
(1 row)
```
Once the logging is enabled, all client-generated SQL queries executed by the node will be written to the `DEV` logging channel, which outputs by default to the primary `cockroach` log file in `/cockroach-data/logs`. Use the symlink `cockroach.log` to open the most recent log.
```text theme={"theme":{"light":"catppuccin-mocha","dark":"catppuccin-mocha"}}
I180402 19:12:28.112957 394661 sql/exec_log.go:173 [n1,client=127.0.0.1:50155,user=root] exec "psql" {} "SELECT version()" {} 0.795 1 ""
```
## Configure CockroachDB to send traces to a third-party trace collector
You can configure CockroachDB to send traces to a third-party collector. CockroachDB supports [Jaeger](https://www.jaegertracing.io/), [Zipkin](https://zipkin.io/), and any trace collector that can ingest traces over the standard OTLP protocol. Enabling tracing also activates all the log messages, at all verbosity levels, as traces include the log messages printed in the respective trace context.
Enabling full tracing is expensive both in terms of CPU usage and memory footprint, and is not suitable for high throughput production environments.
You can configure the CockroachDB tracer to route to the OpenTelemetry tracer, with OpenTelemetry being supported by all observability tools. In particular, you can configure CockroachDB to output traces to:
* A collector that uses the OpenTelemetry Protocol (OTLP).
* The OpenTelemetry (OTEL) collector, which can in turn route them to other tools. The OTEL collector is a canonical collector, using the OTLP protocol, that can buffer traces and perform some processing on them before exporting them to Jaeger, Zipkin, and other OTLP tools.
* Jaeger or Zipkin using their native protocols. This is implemented by using the Jaeger and Zipkin dedicated "exporters" from the OTEL SDK.
The following cluster settings are supported:
| Setting | Type | Default | Description |
| ------------------------------- | ------ | ------- | ------------------------------------------------------------------------------------------------------------------------------------------------ |
| `trace.opentelemetry.collector` | string | \`\` | The address of an OpenTelemetry trace collector to receive traces using the OTEL gRPC protocol, as `:`. If no port is specified, `4317` is used. |
| `trace.jaeger.agent` | string | \`\` | The address of a Jaeger agent to receive traces using the Jaeger UDP Thrift protocol, as `:`. If no port is specified, `6381` is used. |
| `trace.zipkin.collector` | string | \`\` | The address of a Zipkin instance to receive traces, as `:`. If no port is specified, `9411` is used. |
## Troubleshoot SQL client application problems
### High client CPU load, connection pool exhaustion, or increased connection latency when SCRAM Password-based Authentication is enabled
* [Overview](#overview)
* [Mitigation steps while keeping SCRAM enabled](#mitigation-steps-while-keeping-scram-enabled)
* [Downgrade from SCRAM authentication](#downgrade-from-scram-authentication)
#### Overview
When SASL/SCRAM-SHA-256 Secure Password-based Authentication (SCRAM Authentication) is enabled on a cluster, some additional CPU load is incurred on client applications, which are responsible for handling SCRAM hashing. It's important to plan for this additional CPU load to avoid performance degradation, CPU starvation, and connection pool exhaustion on the client. For example, the following set of circumstances can exhaust the client application's resources:
1. SCRAM Authentication is enabled on the cluster (the `server.user_login.password_encryption` cluster setting is set to `scram-sha-256` ).
2. The client driver's connection pool has no defined maximum number of connections, or is configured to close idle connections eagerly.
3. The client application issues transactions concurrently.
In this situation, each new connection uses more CPU on the client application server than connecting to a cluster without SCRAM Authentication enabled. Because of this additional CPU load, each concurrent transaction is slower, and a larger quantity of concurrent transactions can accumulate, in conjunction with a larger number of concurrent connections. In this situation, it can be difficult for the client application server to recover.
Some applications may also see increased connection latency. This can happen because SCRAM incurs additional round trips during authentication which can add latency to the initial connection.
For more information about how SCRAM works, see SASL/SCRAM-SHA-256 Secure Password-based Authentication.
#### Mitigation steps while keeping SCRAM enabled
To mitigate against this situation while keeping SCRAM authentication enabled, Cockroach Labs recommends that you:
* Test and adjust your workloads in batches when migrating to SCRAM authentication.
* Start by enabling SCRAM authentication in a testing environment, and test the performance of your client application against the types of workloads you expect it to handle in production before rolling the changes out to production.
* Limit the maximum number of connections in the client driver's connection pool.
* Limit the maximum number of concurrent transactions the client application can issue.
If the above steps don't work, you can try lowering the default hashing cost and reapplying the password as described below.
##### Lower default hashing cost and reapply the password
To decrease the CPU usage of SCRAM password hashing while keeping SCRAM enabled:
1. Set the `server.user_login.password_hashes.default_cost.scram_sha_256` cluster setting to `4096`:
```sql theme={"theme":{"light":"catppuccin-mocha","dark":"catppuccin-mocha"}}
SET CLUSTER SETTING server.user_login.password_hashes.default_cost.scram_sha_256 = 4096;
```
2. Make sure the `server.user_login.rehash_scram_stored_passwords_on_cost_change.enabled` cluster setting is set to `true` (the default).
When lowering the default hashing cost, we recommend that you use strong, complex passwords for SQL users.
If you are still seeing higher connection latencies than before, you can [downgrade from SCRAM authentication](#downgrade-from-scram-authentication).
#### Downgrade from SCRAM authentication
As an alternative to the [mitigation steps listed above](#mitigation-steps-while-keeping-scram-enabled), you can downgrade from SCRAM authentication to bcrypt as follows:
1. Set the `server.user_login.password_encryption` cluster setting to `crdb-bcrypt`:
```sql theme={"theme":{"light":"catppuccin-mocha","dark":"catppuccin-mocha"}}
SET CLUSTER SETTING server.user_login.password_encryption = 'crdb-bcrypt';
```
2. Ensure the `server.user_login.downgrade_scram_stored_passwords_to_bcrypt.enabled` cluster setting is set to `true`:
```sql theme={"theme":{"light":"catppuccin-mocha","dark":"catppuccin-mocha"}}
SET CLUSTER SETTING server.user_login.downgrade_scram_stored_passwords_to_bcrypt.enabled = true;
```
The `server.user_login.upgrade_bcrypt_stored_passwords_to_scram.enabled` cluster setting can be left at its default value of `true`.
## Something else?
Try searching the rest of our docs for answers:
* Connect to a CockroachDB Cluster
* Run Multi-Statement Transactions
* Optimize Statement Performance Overview
* Common Errors and Solutions
* Transactions
* Client-side transaction retry handling
* SQL Layer
Or try using our other support resources, including:
* [CockroachDB Community Forum](https://forum.cockroachlabs.com/)
* [CockroachDB Community Slack](https://cockroachdb.slack.com/)
* [StackOverflow](http://stackoverflow.com/questions/tagged/cockroachdb)
* [CockroachDB Support Portal](https://support.cockroachlabs.com/)
4. Click **Find Traces**.
Instead of searching through log messages in an unstructured fashion, the logs are now graphed in a tree format based on how the contexts were passed around. This also traverses machine boundaries so you don't have to look at different flat `.log` files to correlate events.
Jaeger's memory storage works well for small use cases, but can result in out of memory errors when collecting many traces over a long period of time. Jaeger also supports disk-backed local storage using [Badger](https://www.jaegertracing.io/docs/1.32/deployment#badger---local-storage). To use this, start Jaeger by running the following Docker command:
```shell theme={"theme":{"light":"catppuccin-mocha","dark":"catppuccin-mocha"}}
docker run -d --name jaeger \
-e SPAN_STORAGE_TYPE=badger -e BADGER_EPHEMERAL=false \
-e BADGER_DIRECTORY_VALUE=/badger/data -e BADGER_DIRECTORY_KEY=/badger/key \
-v /mnt/data1/jaeger:/badger \
-p 6831:6831/udp -p 16686:16686 jaegertracing/all-in-one:latest
```
### Log traces for transactions
CockroachDB allows you to trace transactions to help troubleshoot performance issues. Tracing is controlled through the following cluster settings that govern when a transaction trace is captured and emitted.
#### Trace sampling and emission
To enable tracing for a subset of transactions and emit relevant traces to the `SQL_EXEC` logging channel, configure the following cluster settings:
* `sql.trace.txn.sample_rate`: Specifies the probability (between `0.0` and `1.0` ) that a given transaction will have tracing enabled. A value of `0.01` means that approximately 1% of transactions are traced. The default is `1`, which means 100% of transactions are sampled.
* `sql.trace.txn.enable_threshold`: Specifies a duration threshold. A trace is emitted only if a sampled transaction's execution time exceeds this value. When set to `0` (default), tracing is disabled regardless of whether the value of `sql.trace.txn.sample_rate` is greater than `0`.
To emit a trace to the logs, the following conditions must be met:
1. The transaction is selected based on the sampling probability.
2. Its execution duration exceeds the configured threshold.
This approach minimizes overhead by tracing a fraction of the workload and emitting traces only for potentially relevant transactions.
Additional cluster settings that control trace emission are:
* `sql.trace.txn.include_internal.enabled`: Enables inclusion of internal transactions in probabilistic transaction tracing and latency-based logging. This setting is enabled by default. Set this to `false` to omit internal transactions and reduce noise when debugging user workloads.
* `sql.trace.txn.jaeger_json_output.enabled`: Enables output of transaction traces in Jaeger-compatible JSON format for easier ingestion by observability tools. This setting is disabled by default.
#### Trace configuration example
To configure the trace sampling probability and duration, set the following cluster settings:
```sql theme={"theme":{"light":"catppuccin-mocha","dark":"catppuccin-mocha"}}
-- Enable trace sampling at a rate of 1%
SET CLUSTER SETTING sql.trace.txn.sample_rate = 0.01;
-- Emit traces for sampled transactions that run longer than 1s
SET CLUSTER SETTING sql.trace.txn.enable_threshold = '1s';
```
With this configuration, approximately 1% of transactions are traced, and only those running longer than 1s will have their traces written to the logs. In the `SQL_EXEC` log, a line similar to the following precedes the trace:
```text theme={"theme":{"light":"catppuccin-mocha","dark":"catppuccin-mocha"}}
SQL txn took 2.004362083s, exceeding threshold of 1s:
```
### Queries are always slow
If you have consistently slow queries in your cluster, use the Statement Fingerprint page to drill down to an individual statement and collect diagnostics for the statement. A diagnostics bundle contains a record of transaction events across nodes for the SQL statement.
You can also use an `EXPLAIN ANALYZE` statement, which executes a SQL query and returns a physical query plan with execution statistics. You can use query plans to troubleshoot slow queries by indicating where time is being spent, how long a processor (i.e., a component that takes streams of input rows and processes them according to a specification) is not doing work, etc.
Cockroach Labs recommends sending either the diagnostics bundle (preferred) or the `EXPLAIN ANALYZE` output to our support team for analysis.
### Queries are sometimes slow
If the query performance is irregular:
1. Run `SHOW TRACE FOR SESSION` for the query twice: once when the query is performing as expected and once when the query is slow.
2. Contact support to help analyze the outputs of the `SHOW TRACE` command.
### `SELECT` statements are slow
The common reasons for a sub-optimal `SELECT` performance are inefficient scans, full scans, and incorrect use of indexes. To improve the performance of `SELECT` statements, refer to the following documents:
* Table scan best practices
* Indexes best practices
### `SELECT` statements with `GROUP BY` columns are slow
Suppose you have a slow selection query that
* Has a `GROUP BY` clause.
* Uses an index that has a `STORING` clause.
* Where some or all of the columns in the query's `GROUP BY` clause are part of the index's `STORING` clause and are **not** index key columns.
For example:
```sql theme={"theme":{"light":"catppuccin-mocha","dark":"catppuccin-mocha"}}
SELECT
cnt, organization, concat(os, '-', version) AS bucket
FROM
(
SELECT
count(1)::FLOAT8 AS cnt, organization, os, version
FROM
nodes
WHERE
lastseen > ($1)::TIMESTAMPTZ AND lastseen <= ($2)::TIMESTAMPTZ
GROUP BY
organization, os, version
)
Arguments:
$1: '2021-07-27 13:22:09.000058Z'
$2: '2021-10-25 13:22:09.000058Z'
```
The columns in the `GROUP BY` clause are `organization`, `os`, and `version`.
The query plan shows that it is using index `nodes_lastseen_organization_storing`:
```text theme={"theme":{"light":"catppuccin-mocha","dark":"catppuccin-mocha"}}
distribution full
vectorized true
render (cnt float, organization varchar, bucket string)
│ estimated row count 3760
│ render 0 (concat((os)[string], ('-')[string], (version)[string]))[string]
│ render 1 ((count_rows)[int]::FLOAT8)[float]
│ render 2 (organization)[varchar]
└── group (organization varchar, os string, version string, count_rows int)
│ estimated row count 3760
│ aggregate 0 count_rows()
│ group by organization, os, version
└── project (organization varchar, os string, version string)
└── scan (organization varchar, lastseen timestamptz, os string, version string)
estimated row count 2330245
table nodes@nodes_lastseen_organization_storing
spans /2021-07-27T13:22:09.000059Z-/2021-10-25T13:22:09.000058001Z
```
Here is the table schema for the example query:
```sql theme={"theme":{"light":"catppuccin-mocha","dark":"catppuccin-mocha"}}
CREATE TABLE public.nodes (
id VARCHAR(60) NOT NULL,
ampuuid UUID NULL,
organization VARCHAR(60) NULL,
created TIMESTAMPTZ NULL DEFAULT now():::TIMESTAMPTZ,
disabled BOOL NOT NULL DEFAULT false,
lastseen TIMESTAMPTZ NULL DEFAULT now():::TIMESTAMPTZ,
os STRING NOT NULL,
arch STRING NOT NULL,
autotags JSONB NULL,
version STRING NOT NULL DEFAULT '':::STRING,
clone BOOL NOT NULL DEFAULT false,
cloneof VARCHAR(60) NOT NULL DEFAULT '':::STRING,
endpoint_type STRING NOT NULL DEFAULT 'amp':::STRING,
ip INET NULL,
osqueryversion STRING NOT NULL DEFAULT '':::STRING,
CONSTRAINT "primary" PRIMARY KEY (id ASC),
INDEX nodes_organization_ampuuid (organization ASC, ampuuid ASC),
INDEX nodes_created_asc_organization (created ASC, organization ASC),
INDEX nodes_created_desc_organization (created DESC, organization ASC),
INDEX nodes_organization_os_version (organization ASC, os ASC, version ASC),
INDEX nodes_organization_version (organization ASC, version ASC),
INDEX nodes_lastseen_organization_storing (lastseen ASC, organization ASC) STORING (os, version),
FAMILY "primary" (id, ampuuid, organization, created, disabled, lastseen, os, arch, autotags, version, clone, cloneof, endpoint_type, ip, osqueryversion)
);
```
The `nodes_lastseen_organization_storing` index has the `GROUP BY` column `organization` as an index key column. However, the `STORING` clause includes the `GROUP BY` columns `os` and `version`.
#### Solution
Create a new secondary index that has all of the `GROUP BY` columns as key columns in the index.
```sql theme={"theme":{"light":"catppuccin-mocha","dark":"catppuccin-mocha"}}
CREATE INDEX "nodes_lastseen_organization_os_version" (lastseen, organization, os, version)
```
This index allows CockroachDB to perform a streaming `GROUP BY` rather than a hash `GROUP BY`. After you make this change, you should notice an improvement in the latency of the example query.
### `INSERT` and `UPDATE` statements are slow
Use the Statements page to identify the slow SQL statements.
Refer to the following pages to improve `INSERT` and `UPDATE` performance:
* Multi-row DML
* Bulk-Insert best practices
### Cancel running queries
See Cancel long-running queries.
### Low throughput
Throughput is affected by the disk I/O, CPU usage, and network latency. Use the DB Console to check the following metrics:
* Disk I/O: Disk IOPS in progress
* CPU usage: CPU percent
* Network latency: Network Latency
### Query runs out of memory
If your query returns the error code `SQLSTATE: 53200` with the message `ERROR: root: memory budget exceeded`, follow the guidelines in memory budget exceeded.
## Transaction retry errors
Messages with the error code `40001` and the string `restart transaction` are known as *transaction retry errors*. These indicate that a transaction failed due to contention with another concurrent or recent transaction attempting to write to the same data. The transaction needs to be retried by the client.
In most cases, the correct actions to take when encountering transaction retry errors are:
1. Under `SERIALIZABLE` isolation, update your application to support client-side retry handling when transaction retry errors are encountered. Follow the guidance for the specific error type.
2. Take steps to minimize transaction retry errors in the first place. This means reducing transaction contention overall, and increasing the likelihood that CockroachDB can automatically retry a failed transaction.
## Unsupported SQL features
CockroachDB has support for most SQL features.
Additionally, CockroachDB supports the PostgreSQL wire protocol and the majority of its syntax. This means that existing applications can often be migrated to CockroachDB without changing application code.
However, you may encounter features of SQL or the PostgreSQL dialect that are not supported by CockroachDB. For example, the following PostgreSQL features are not supported:
### `CREATE DOMAIN`
CockroachDB does not support `CREATE DOMAIN`.
### PostgreSQL range types
CockroachDB does not support PostgreSQL range types.
### Other unsupported features
* Events.
* Drop primary key.
Each table must have a primary key associated with it. You can drop and add a primary key constraint within a single transaction.
* XML functions.
* Column-level privileges.
* XA syntax.
* Creating a database from a template.
* Dropping a single partition from a table.
* Foreign data wrappers.
* Advisory Lock Functions (although some functions are defined with no-op implementations).
For more information about the differences between CockroachDB and PostgreSQL feature support, see PostgreSQL Compatibility.
For more information about the SQL standard features supported by CockroachDB, see SQL Feature Support.
## Node issues
### Single hot node
A *hot node* is one that has much higher resource usage than other nodes. To determine if you have a hot node in your cluster, access the DB Console and check the following:
* Click **Metrics** and navigate to the following graphs. Hover over each graph to see the per-node values of the metrics. If one of the nodes has a higher value, you have a hot node in your cluster.
* **Replication** dashboard > **Average Queries per Store** graph
* **Overview** dashboard > **Service Latency** graph
* **Hardware** dashboard > **CPU Percent** graph
* **SQL** dashboard > **SQL Connections** graph
* **Hardware** dashboard > **Disk IOPS in Progress** graph
* Open the **Top Ranges** page and check for ranges with significantly higher QPS on any nodes.
#### Solution
* If you have a small table that fits into one range, then only one of the nodes will be used. This is expected behavior. However, you can split your range to distribute the table across multiple nodes.
* If the SQL Connections graph shows that one node has a higher number of SQL connections and other nodes have zero connections, check if your app is set to talk to only one node.
* Check load balancer settings.
* Check for transaction contention.
* If you have a monotonically increasing index column or primary Key, then your index or primary key should be redesigned. For more information, see Unique ID best practices.
* If a range has significantly higher QPS on a node, it may indicate a hotspot that needs to be addressed. For more information, refer to Hot range.
* If you have a monotonically increasing index column or primary key, then your index or primary key should be redesigned. See Unique ID best practices for more information.
### Per-node queries per second (QPS) is high
If a cluster is not idle, it is useful to monitor the per-node queries per second. CockroachDB will automatically distribute load throughout the cluster. If one or more nodes is not performing any queries there is likely something to investigate. See `exec_success` and `exec_errors` which track operations at the KV layer and `sql_{select,insert,update,delete}_count` which track operations at the SQL layer.
### Increasing number of nodes does not improve performance
See Why would increasing the number of nodes not result in more operations per second?
### `bad connection` and `closed` responses
A response of `bad connection` or `closed` normally indicates that the node to which you are connected has terminated. You can check this by connecting to another node in the cluster and running `cockroach node status`.
Once you find the node, you can check its logs (stored in `cockroach-data/logs` by default).
Because this kind of behavior is unexpected, you should contact Support.
### Log queries executed by a specific node
If you are testing CockroachDB locally and want to log queries executed by a specific node, you can either pass a CLI flag at node startup or execute a SQL function on a running node.
Using the CLI to start a new node, use the `--vmodule` flag with the `cockroach start` command. For example, to start a single node locally and log all client-generated SQL queries it executes, run:
```shell theme={"theme":{"light":"catppuccin-mocha","dark":"catppuccin-mocha"}}
$ cockroach start --insecure --listen-addr=localhost --vmodule=exec_log=2 --join=
To log CockroachDB-generated SQL queries as well, use `--vmodule=exec_log=3`.
From the SQL prompt on a running node, execute the `crdb_internal.set_vmodule()` function:
```sql theme={"theme":{"light":"catppuccin-mocha","dark":"catppuccin-mocha"}}
> SELECT crdb_internal.set_vmodule('exec_log=2');
```
This will result in the following output:
```text theme={"theme":{"light":"catppuccin-mocha","dark":"catppuccin-mocha"}}
crdb_internal.set_vmodule
+---------------------------+
0
(1 row)
```
Once the logging is enabled, all client-generated SQL queries executed by the node will be written to the `DEV` logging channel, which outputs by default to the primary `cockroach` log file in `/cockroach-data/logs`. Use the symlink `cockroach.log` to open the most recent log.
```text theme={"theme":{"light":"catppuccin-mocha","dark":"catppuccin-mocha"}}
I180402 19:12:28.112957 394661 sql/exec_log.go:173 [n1,client=127.0.0.1:50155,user=root] exec "psql" {} "SELECT version()" {} 0.795 1 ""
```
## Configure CockroachDB to send traces to a third-party trace collector
You can configure CockroachDB to send traces to a third-party collector. CockroachDB supports [Jaeger](https://www.jaegertracing.io/), [Zipkin](https://zipkin.io/), and any trace collector that can ingest traces over the standard OTLP protocol. Enabling tracing also activates all the log messages, at all verbosity levels, as traces include the log messages printed in the respective trace context.
Enabling full tracing is expensive both in terms of CPU usage and memory footprint, and is not suitable for high throughput production environments.
You can configure the CockroachDB tracer to route to the OpenTelemetry tracer, with OpenTelemetry being supported by all observability tools. In particular, you can configure CockroachDB to output traces to:
* A collector that uses the OpenTelemetry Protocol (OTLP).
* The OpenTelemetry (OTEL) collector, which can in turn route them to other tools. The OTEL collector is a canonical collector, using the OTLP protocol, that can buffer traces and perform some processing on them before exporting them to Jaeger, Zipkin, and other OTLP tools.
* Jaeger or Zipkin using their native protocols. This is implemented by using the Jaeger and Zipkin dedicated "exporters" from the OTEL SDK.
The following cluster settings are supported:
| Setting | Type | Default | Description |
| ------------------------------- | ------ | ------- | ------------------------------------------------------------------------------------------------------------------------------------------------ |
| `trace.opentelemetry.collector` | string | \`\` | The address of an OpenTelemetry trace collector to receive traces using the OTEL gRPC protocol, as `:`. If no port is specified, `4317` is used. |
| `trace.jaeger.agent` | string | \`\` | The address of a Jaeger agent to receive traces using the Jaeger UDP Thrift protocol, as `:`. If no port is specified, `6381` is used. |
| `trace.zipkin.collector` | string | \`\` | The address of a Zipkin instance to receive traces, as `:`. If no port is specified, `9411` is used. |
## Troubleshoot SQL client application problems
### High client CPU load, connection pool exhaustion, or increased connection latency when SCRAM Password-based Authentication is enabled
* [Overview](#overview)
* [Mitigation steps while keeping SCRAM enabled](#mitigation-steps-while-keeping-scram-enabled)
* [Downgrade from SCRAM authentication](#downgrade-from-scram-authentication)
#### Overview
When SASL/SCRAM-SHA-256 Secure Password-based Authentication (SCRAM Authentication) is enabled on a cluster, some additional CPU load is incurred on client applications, which are responsible for handling SCRAM hashing. It's important to plan for this additional CPU load to avoid performance degradation, CPU starvation, and connection pool exhaustion on the client. For example, the following set of circumstances can exhaust the client application's resources:
1. SCRAM Authentication is enabled on the cluster (the `server.user_login.password_encryption` cluster setting is set to `scram-sha-256` ).
2. The client driver's connection pool has no defined maximum number of connections, or is configured to close idle connections eagerly.
3. The client application issues transactions concurrently.
In this situation, each new connection uses more CPU on the client application server than connecting to a cluster without SCRAM Authentication enabled. Because of this additional CPU load, each concurrent transaction is slower, and a larger quantity of concurrent transactions can accumulate, in conjunction with a larger number of concurrent connections. In this situation, it can be difficult for the client application server to recover.
Some applications may also see increased connection latency. This can happen because SCRAM incurs additional round trips during authentication which can add latency to the initial connection.
For more information about how SCRAM works, see SASL/SCRAM-SHA-256 Secure Password-based Authentication.
#### Mitigation steps while keeping SCRAM enabled
To mitigate against this situation while keeping SCRAM authentication enabled, Cockroach Labs recommends that you:
* Test and adjust your workloads in batches when migrating to SCRAM authentication.
* Start by enabling SCRAM authentication in a testing environment, and test the performance of your client application against the types of workloads you expect it to handle in production before rolling the changes out to production.
* Limit the maximum number of connections in the client driver's connection pool.
* Limit the maximum number of concurrent transactions the client application can issue.
If the above steps don't work, you can try lowering the default hashing cost and reapplying the password as described below.
##### Lower default hashing cost and reapply the password
To decrease the CPU usage of SCRAM password hashing while keeping SCRAM enabled:
1. Set the `server.user_login.password_hashes.default_cost.scram_sha_256` cluster setting to `4096`:
```sql theme={"theme":{"light":"catppuccin-mocha","dark":"catppuccin-mocha"}}
SET CLUSTER SETTING server.user_login.password_hashes.default_cost.scram_sha_256 = 4096;
```
2. Make sure the `server.user_login.rehash_scram_stored_passwords_on_cost_change.enabled` cluster setting is set to `true` (the default).
When lowering the default hashing cost, we recommend that you use strong, complex passwords for SQL users.
If you are still seeing higher connection latencies than before, you can [downgrade from SCRAM authentication](#downgrade-from-scram-authentication).
#### Downgrade from SCRAM authentication
As an alternative to the [mitigation steps listed above](#mitigation-steps-while-keeping-scram-enabled), you can downgrade from SCRAM authentication to bcrypt as follows:
1. Set the `server.user_login.password_encryption` cluster setting to `crdb-bcrypt`:
```sql theme={"theme":{"light":"catppuccin-mocha","dark":"catppuccin-mocha"}}
SET CLUSTER SETTING server.user_login.password_encryption = 'crdb-bcrypt';
```
2. Ensure the `server.user_login.downgrade_scram_stored_passwords_to_bcrypt.enabled` cluster setting is set to `true`:
```sql theme={"theme":{"light":"catppuccin-mocha","dark":"catppuccin-mocha"}}
SET CLUSTER SETTING server.user_login.downgrade_scram_stored_passwords_to_bcrypt.enabled = true;
```
The `server.user_login.upgrade_bcrypt_stored_passwords_to_scram.enabled` cluster setting can be left at its default value of `true`.
## Something else?
Try searching the rest of our docs for answers:
* Connect to a CockroachDB Cluster
* Run Multi-Statement Transactions
* Optimize Statement Performance Overview
* Common Errors and Solutions
* Transactions
* Client-side transaction retry handling
* SQL Layer
Or try using our other support resources, including:
* [CockroachDB Community Forum](https://forum.cockroachlabs.com/)
* [CockroachDB Community Slack](https://cockroachdb.slack.com/)
* [StackOverflow](http://stackoverflow.com/questions/tagged/cockroachdb)
* [CockroachDB Support Portal](https://support.cockroachlabs.com/)