> ## Documentation Index
> Fetch the complete documentation index at: https://cockroachlabs.mintlify.site/llms.txt
> Use this file to discover all available pages before exploring further.
# Cluster Overview Page
export const InternalLink = ({version, path = "", children, ...props}) => {
let detectedVersion = version || "stable";
if (typeof window !== 'undefined' && !version) {
const match = window.location.pathname.match(/\/docs\/([^/]+)/);
if (match) {
detectedVersion = match[1];
}
}
const normalizedPath = path.startsWith("/") ? path.slice(1) : path;
return
{children}
;
};
The **Cluster Overview** page of the DB Console displays key metrics about your cluster and individual nodes. These include:
* Liveness status
* Replication status
* Uptime
* Hardware usage
Enable the [Node Map](#node-map) view for a visual representation of your cluster's geographic layout.
## Cluster Overview panel
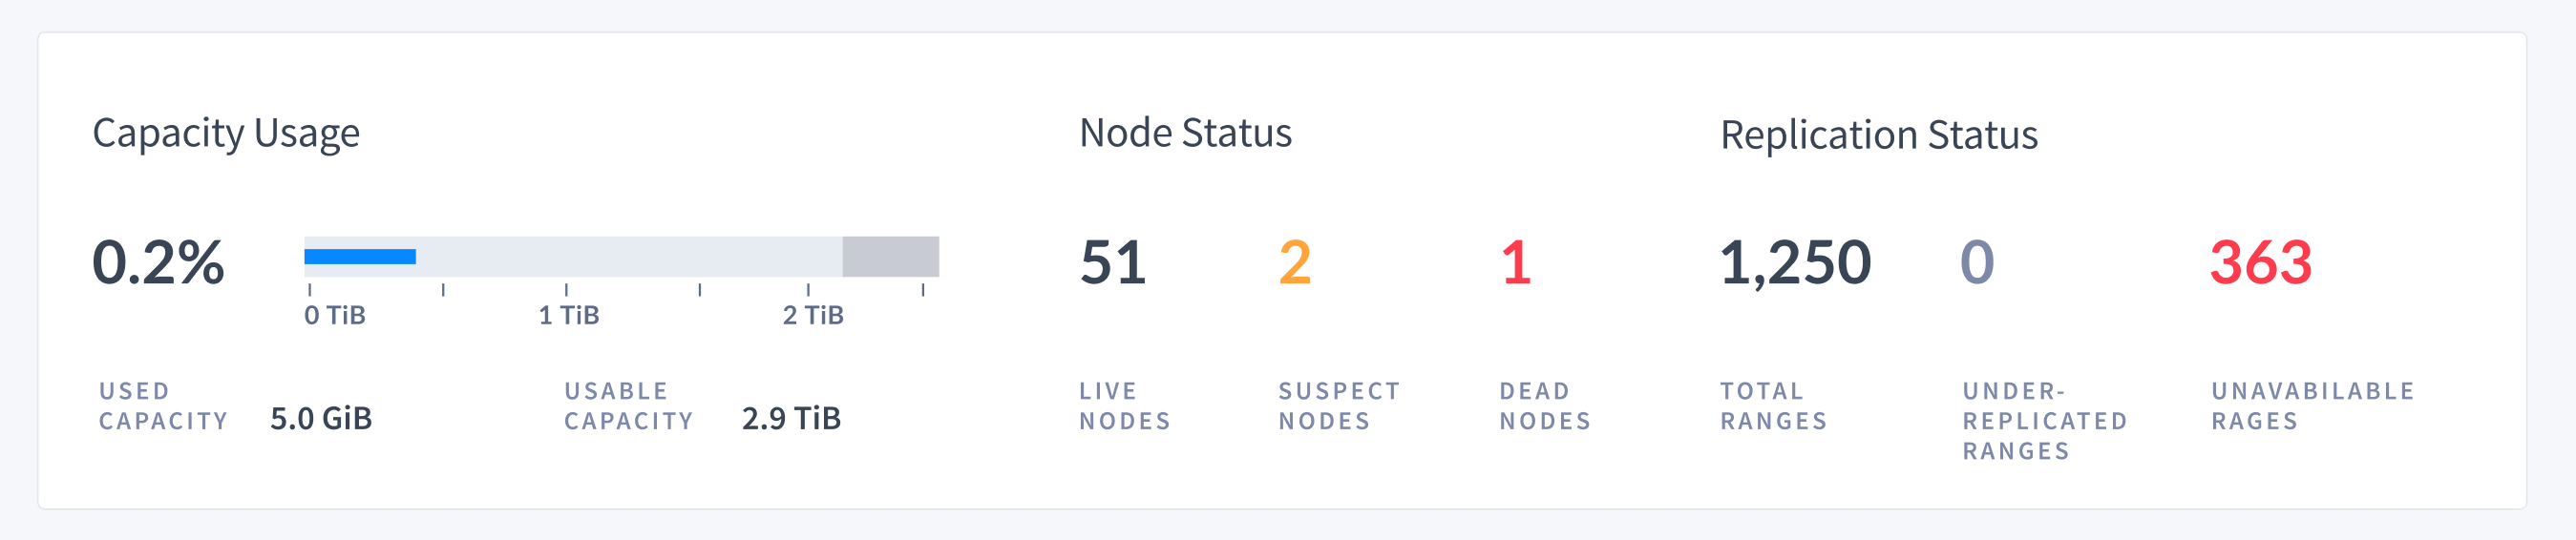
Use the **Cluster Overview** panel to quickly assess the capacity and health of your cluster.
 | Metric | Description |
| ------------------------------------------------ | --------------------------------------------------------------------------------------------------------------------------------------------------------------------------------------------------------------------------------------------------------------------------------------------------------------------------------------------------------------------------------------------------------------------------------------------------------------------------------------------------------------------------------------------- |
| Capacity Usage |
| Metric | Description |
| ------------------------------------------------ | --------------------------------------------------------------------------------------------------------------------------------------------------------------------------------------------------------------------------------------------------------------------------------------------------------------------------------------------------------------------------------------------------------------------------------------------------------------------------------------------------------------------------------------------- |
| Capacity Usage | - Used: The total disk space in use by CockroachDB data across all nodes. This excludes the disk space used by the Cockroach binary, operating system, and other system files.
- Usable: The total disk space usable by CockroachDB data across all nodes. This cannot exceed the store size, if one has been set using `--store`.
See [Capacity metrics](#capacity-metrics) for details on how these values are calculated. |
| Node Status | - The number of `LIVE` nodes in the cluster.
- The number of `SUSPECT` nodes in the cluster. A node is considered suspect if its liveness status is unavailable or the node is in the process of [decommissioning](#decommissioned-nodes) or draining.
- The number of `DEAD` nodes in the cluster.
|
| Replication Status | - The total number of ranges in the cluster.
- The number of under-replicated ranges in the cluster. A non-zero number indicates an unstable cluster.
- The number of unavailable ranges in the cluster. A non-zero number indicates an unstable cluster.
|
### Capacity metrics
The [Cluster Overview](#cluster-overview-panel), [Node List](#node-list), and [Node Map](#node-map) display **Capacity Usage** by the CockroachDB store (the directory on each node where CockroachDB reads and writes its data) as a percentage of the disk space that is **usable** on the cluster, locality, or node.
Usable disk space is constrained by the following:
* The maximum store size, which may be specified using the `--store` flag when starting nodes. If no store size has been explicitly set, the actual disk capacity is used as the limit. This value is displayed on the Capacity graph in the Storage dashboard.
* Any disk space occupied by non-CockroachDB data. This may include the operating system and other system files, as well as the Cockroach binary itself.
The DB Console thus calculates **usable** disk space as the sum of empty disk space, up to the value of the maximum store size, and disk space that is already being **used** by CockroachDB data.
If a node is currently unavailable, the last-known capacity usage will be shown, and noted as stale.
If you are testing your deployment locally with multiple CockroachDB nodes running on a single machine (this is not recommended in production), you must explicitly set the store size per node in order to display the correct capacity. Otherwise, the machine's actual disk capacity will be counted as a separate store for each node, thus inflating the computed capacity.
For instructions on how to free up disk space as quickly as possible after dropping a table, see How can I free up disk space that was used by a dropped table?
## Node List
The **Node List** groups nodes by locality. The lowest-level locality tier is used to organize the Node List. Hover over a locality to see all localities for the group of nodes.
We recommend defining `--locality` flags when starting nodes. CockroachDB uses locality to distribute replicas and mitigate network latency. Locality is also a prerequisite for enabling the [Node Map](#node-map).
### Node status
Each locality and node is displayed with its current operational status.
| Locality Status | Description |
| --------------- | ------------------------------------------------------------------------------------------------- |
| `LIVE` | All nodes in the locality are live. |
| `WARNING` | Locality has 1 or more `SUSPECT`, `DECOMMISSIONING`, or `DEAD` nodes (red indicates a dead node). |
| Node Status | Description |
| ----------------- | ---------------------------------------------------------------------------------------------------------------------------------------------- |
| `LIVE` | Node is online and updating its liveness record. |
| `SUSPECT` | Node has an unavailable liveness status. |
| `DRAINING` | Node is in the process of draining or has been drained. |
| `DECOMMISSIONING` | Node is in the [process of decommissioning](node-shutdown.html?filters=decommission#decommissioning). |
| `DEAD` | Node has not updated its liveness record for 5 minutes. |
Nodes are considered dead once they have not updated their liveness record for the duration of the `server.time_until_store_dead` cluster setting (5 minutes by default). At this point, CockroachDB begins to rebalance replicas from dead nodes to live nodes, using the unaffected replicas as sources.
### Node details
The following details are also shown.
| Column | Description |
| -------------- | --------------------------------------------------------------------------------------------------------------------------------------------------------------------------------------------------------------------------------- |
| Node Count | Number of nodes in the locality. [Decommissioned nodes](node-shutdown.html?filters=decommission) are not included in this count. |
| Nodes | Nodes are grouped by locality and displayed with their address and node ID (the ID is the number that is prepended by `n`). Click the address to view node statistics. Hover over a row and click **Logs** to see the node's log. |
| Uptime | Amount of time the node has been running. |
| Replicas | Number of replicas on the node or in the locality. |
| Capacity Usage | Percentage of usable disk space occupied by CockroachDB data on the node or in the locality. See [Capacity metrics](#capacity-metrics). |
| Memory Usage | Memory used by CockroachDB as a percentage of the total memory on the node or in the locality. |
| vCPUs | Number of virtual CPUs available to the node, measured using cgroups to reflect the compute resources reserved in Kubernetes and other virtualized environments. |
| Version | Build tag of the CockroachDB version installed on the node. |
### Decommissioned nodes
Nodes that have [completed decommissioning](node-shutdown.html?filters=decommission#status-change) are listed in the table of **Recently Decommissioned Nodes**, indicating that they are removed from the cluster.
| Node Status | Description |
| ---------------------------- | ------------------------------------------------------------------------------------------------------------------------------------------------------------------------------------ |
| `NODE_STATUS_UNAVAILABLE` | Node has been recently decommissioned. |
| `NODE_STATUS_DECOMMISSIONED` | Node has been decommissioned for the duration set by the `server.time_until_store_dead` cluster setting (5 minutes by default). |
You can see the full history of decommissioned nodes by clicking **View all decommissioned nodes**.
For details about the decommissioning process, see [Node Shutdown](node-shutdown.html?filters=decommission#node-shutdown-sequence).
## Node Map
The **Node Map** visualizes the geographical configuration of your cluster. It requires that `--locality` flags have been defined for your nodes.
For guidance on enabling and configuring the node map, see Enable the Node Map.
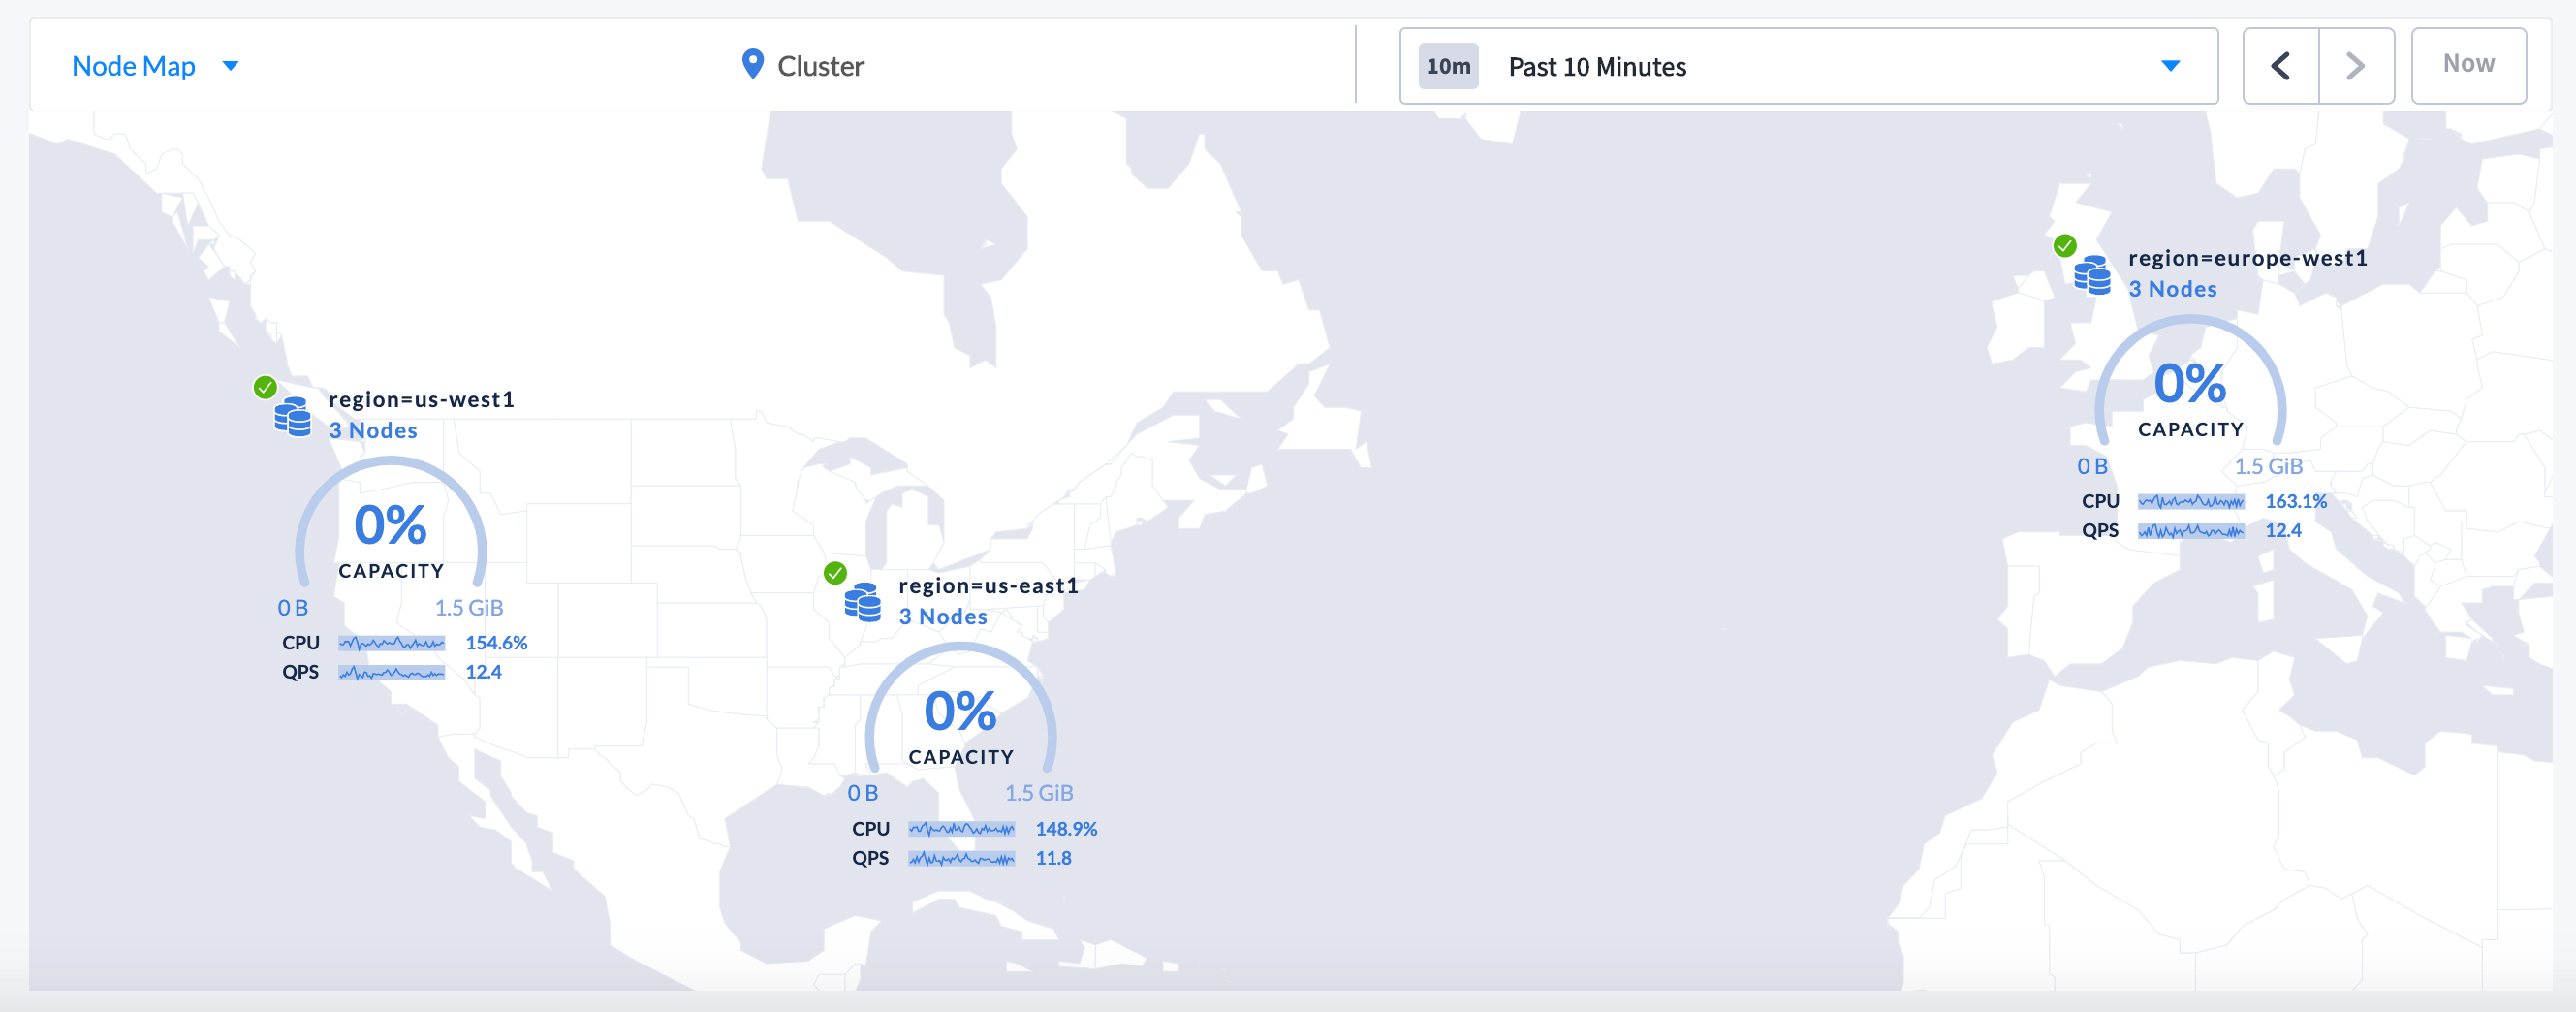 The Node Map uses the longitude and latitude of each locality to position the components on the map. The map is populated with [**locality components**](#locality-component) and [**node components**](#node-component).
### Locality component
A locality component represents capacity, CPU, and QPS metrics for a given locality.
The map shows the components for the highest-level locality tier (e.g., region). You can click on the **Node Count** of a locality component to view any lower-level localities (e.g., availability zone).
For details on how **Capacity Usage** is calculated, see [Capacity metrics](#capacity-metrics).
The Node Map uses the longitude and latitude of each locality to position the components on the map. The map is populated with [**locality components**](#locality-component) and [**node components**](#node-component).
### Locality component
A locality component represents capacity, CPU, and QPS metrics for a given locality.
The map shows the components for the highest-level locality tier (e.g., region). You can click on the **Node Count** of a locality component to view any lower-level localities (e.g., availability zone).
For details on how **Capacity Usage** is calculated, see [Capacity metrics](#capacity-metrics).
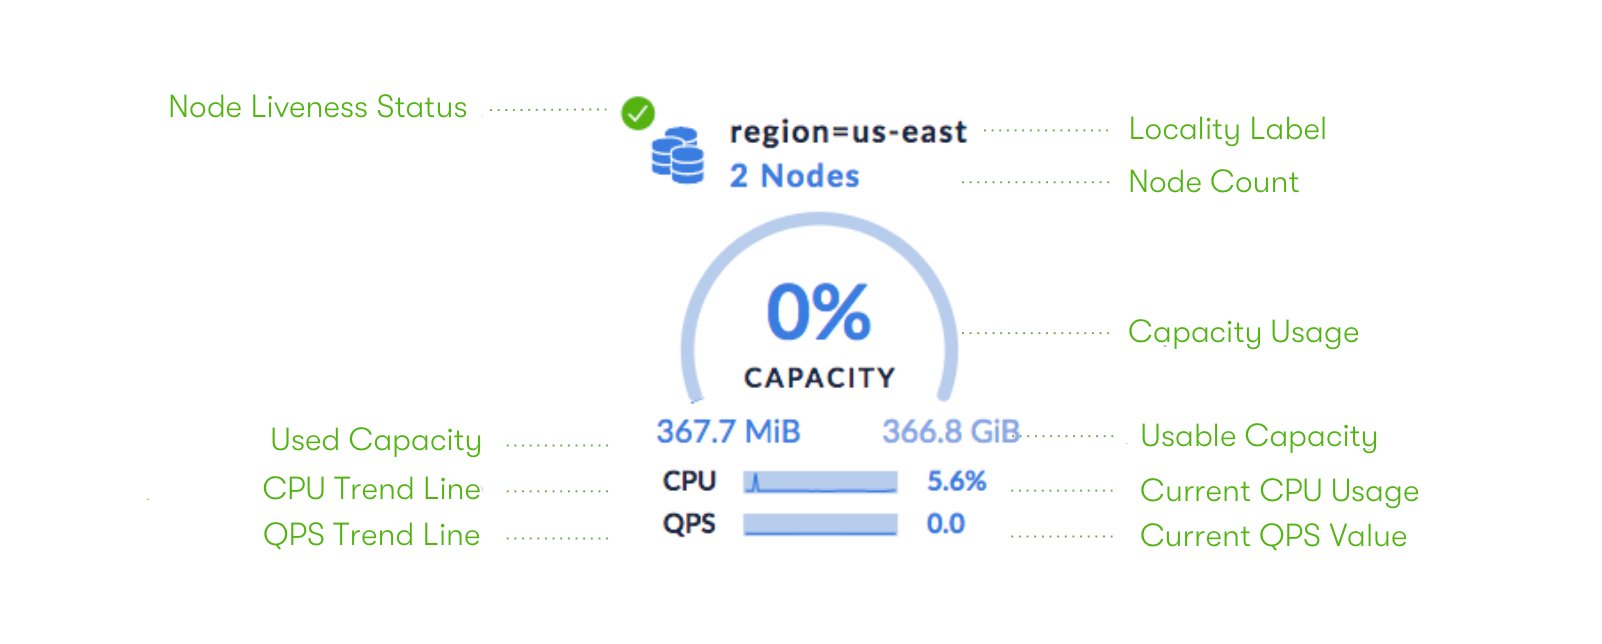 On multi-core systems, the displayed CPU usage can be greater than 100%. Full utilization of 1 core is considered as 100% CPU usage. If you have *n* cores, then CPU usage can range from 0% (indicating an idle system) to (*n* \* 100)% (indicating full utilization).
### Node component
A node component represents capacity, CPU, and QPS metrics for a given node.
Node components are accessed by clicking on the **Node Count** of the lowest-level [locality component](#locality-component).
For details on how **Capacity Usage** is calculated, see [Capacity metrics](#capacity-metrics).
On multi-core systems, the displayed CPU usage can be greater than 100%. Full utilization of 1 core is considered as 100% CPU usage. If you have *n* cores, then CPU usage can range from 0% (indicating an idle system) to (*n* \* 100)% (indicating full utilization).
### Node component
A node component represents capacity, CPU, and QPS metrics for a given node.
Node components are accessed by clicking on the **Node Count** of the lowest-level [locality component](#locality-component).
For details on how **Capacity Usage** is calculated, see [Capacity metrics](#capacity-metrics).
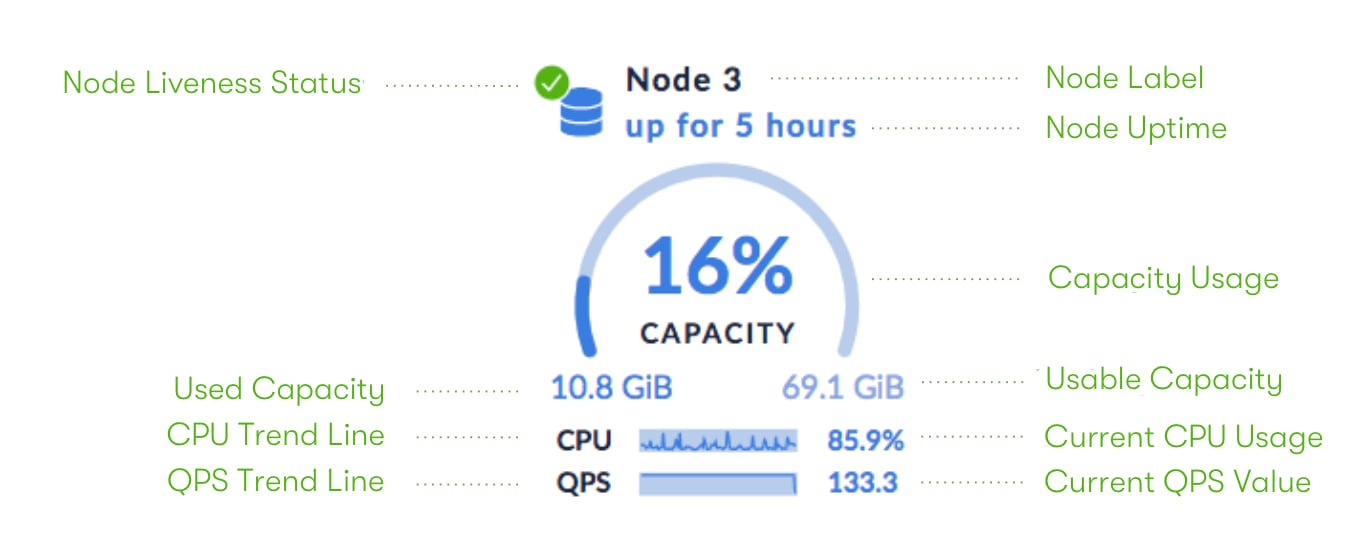 On multi-core systems, the displayed CPU usage can be greater than 100%. Full utilization of 1 core is considered as 100% CPU usage. If you have *n* cores, then CPU usage can range from 0% (indicating an idle system) to (*n* \* 100)% (indicating full utilization).
## See also
* Production Checklist
* Locality
* Troubleshooting Overview
* Support Resources
* Raw Status Endpoints
On multi-core systems, the displayed CPU usage can be greater than 100%. Full utilization of 1 core is considered as 100% CPU usage. If you have *n* cores, then CPU usage can range from 0% (indicating an idle system) to (*n* \* 100)% (indicating full utilization).
## See also
* Production Checklist
* Locality
* Troubleshooting Overview
* Support Resources
* Raw Status Endpoints