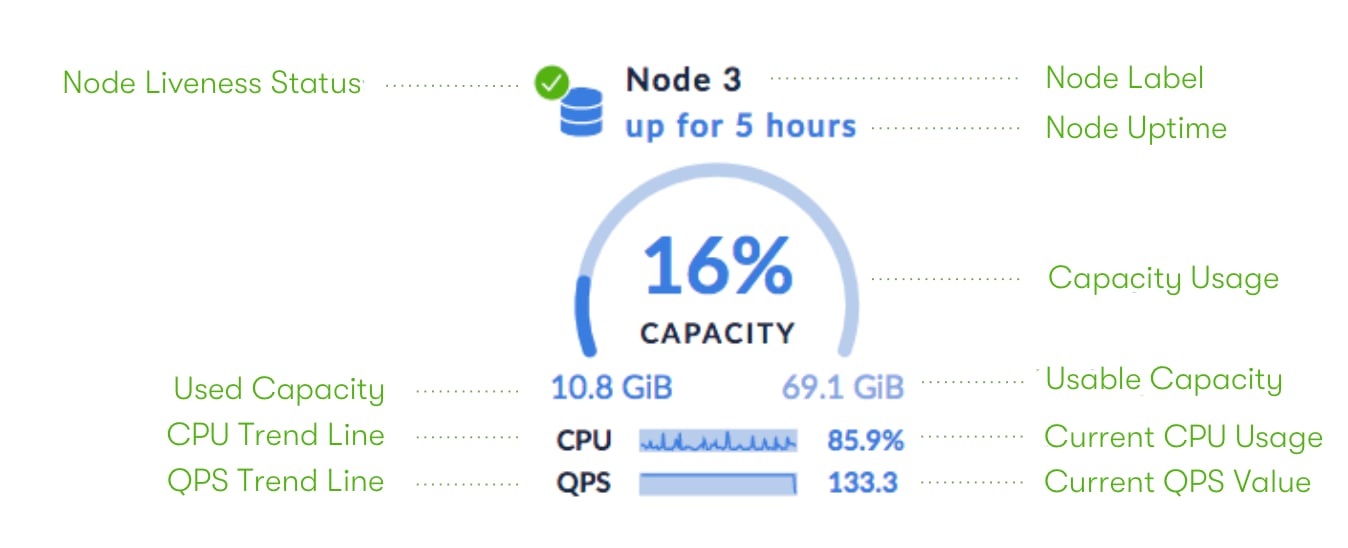

- Liveness status
- Replication status
- Uptime
- Hardware usage
Cluster Overview panel
Use the Cluster Overview panel to quickly assess the capacity and health of your cluster.
Capacity metrics
The Cluster Overview, Node List, and Node Map display Capacity Usage by the CockroachDB (the directory on each node where CockroachDB reads and writes its data) as a percentage of the disk space that is usable on the cluster, locality, or node. Usable disk space is constrained by the following:- The maximum store size, which may be specified using the flag when starting nodes. If no store size has been explicitly set, the actual disk capacity is used as the limit. This value is displayed on the Capacity graph in the .
- Any disk space occupied by non-CockroachDB data. This may include the operating system and other system files, as well as the Cockroach binary itself.
Node List
The Node List groups nodes by locality. The lowest-level locality tier is used to organize the Node List. Hover over a locality to see all localities for the group of nodes.Node status
Each locality and node is displayed with its current operational status.Nodes are considered dead once they have not for the duration of the
server.time_until_store_dead (5 minutes by default). At this point, CockroachDB begins to rebalance replicas from dead nodes to live nodes, using the unaffected replicas as sources.Node details
The following details are also shown.Decommissioned nodes
Nodes that have are listed in the table of Recently Decommissioned Nodes, indicating that they are removed from the cluster.
You can see the full history of decommissioned nodes by clicking View all decommissioned nodes.
For details about the decommissioning process, see .
Node Map
The Node Map visualizes the geographical configuration of your cluster. It requires that for your nodes. For guidance on enabling and configuring the node map, see .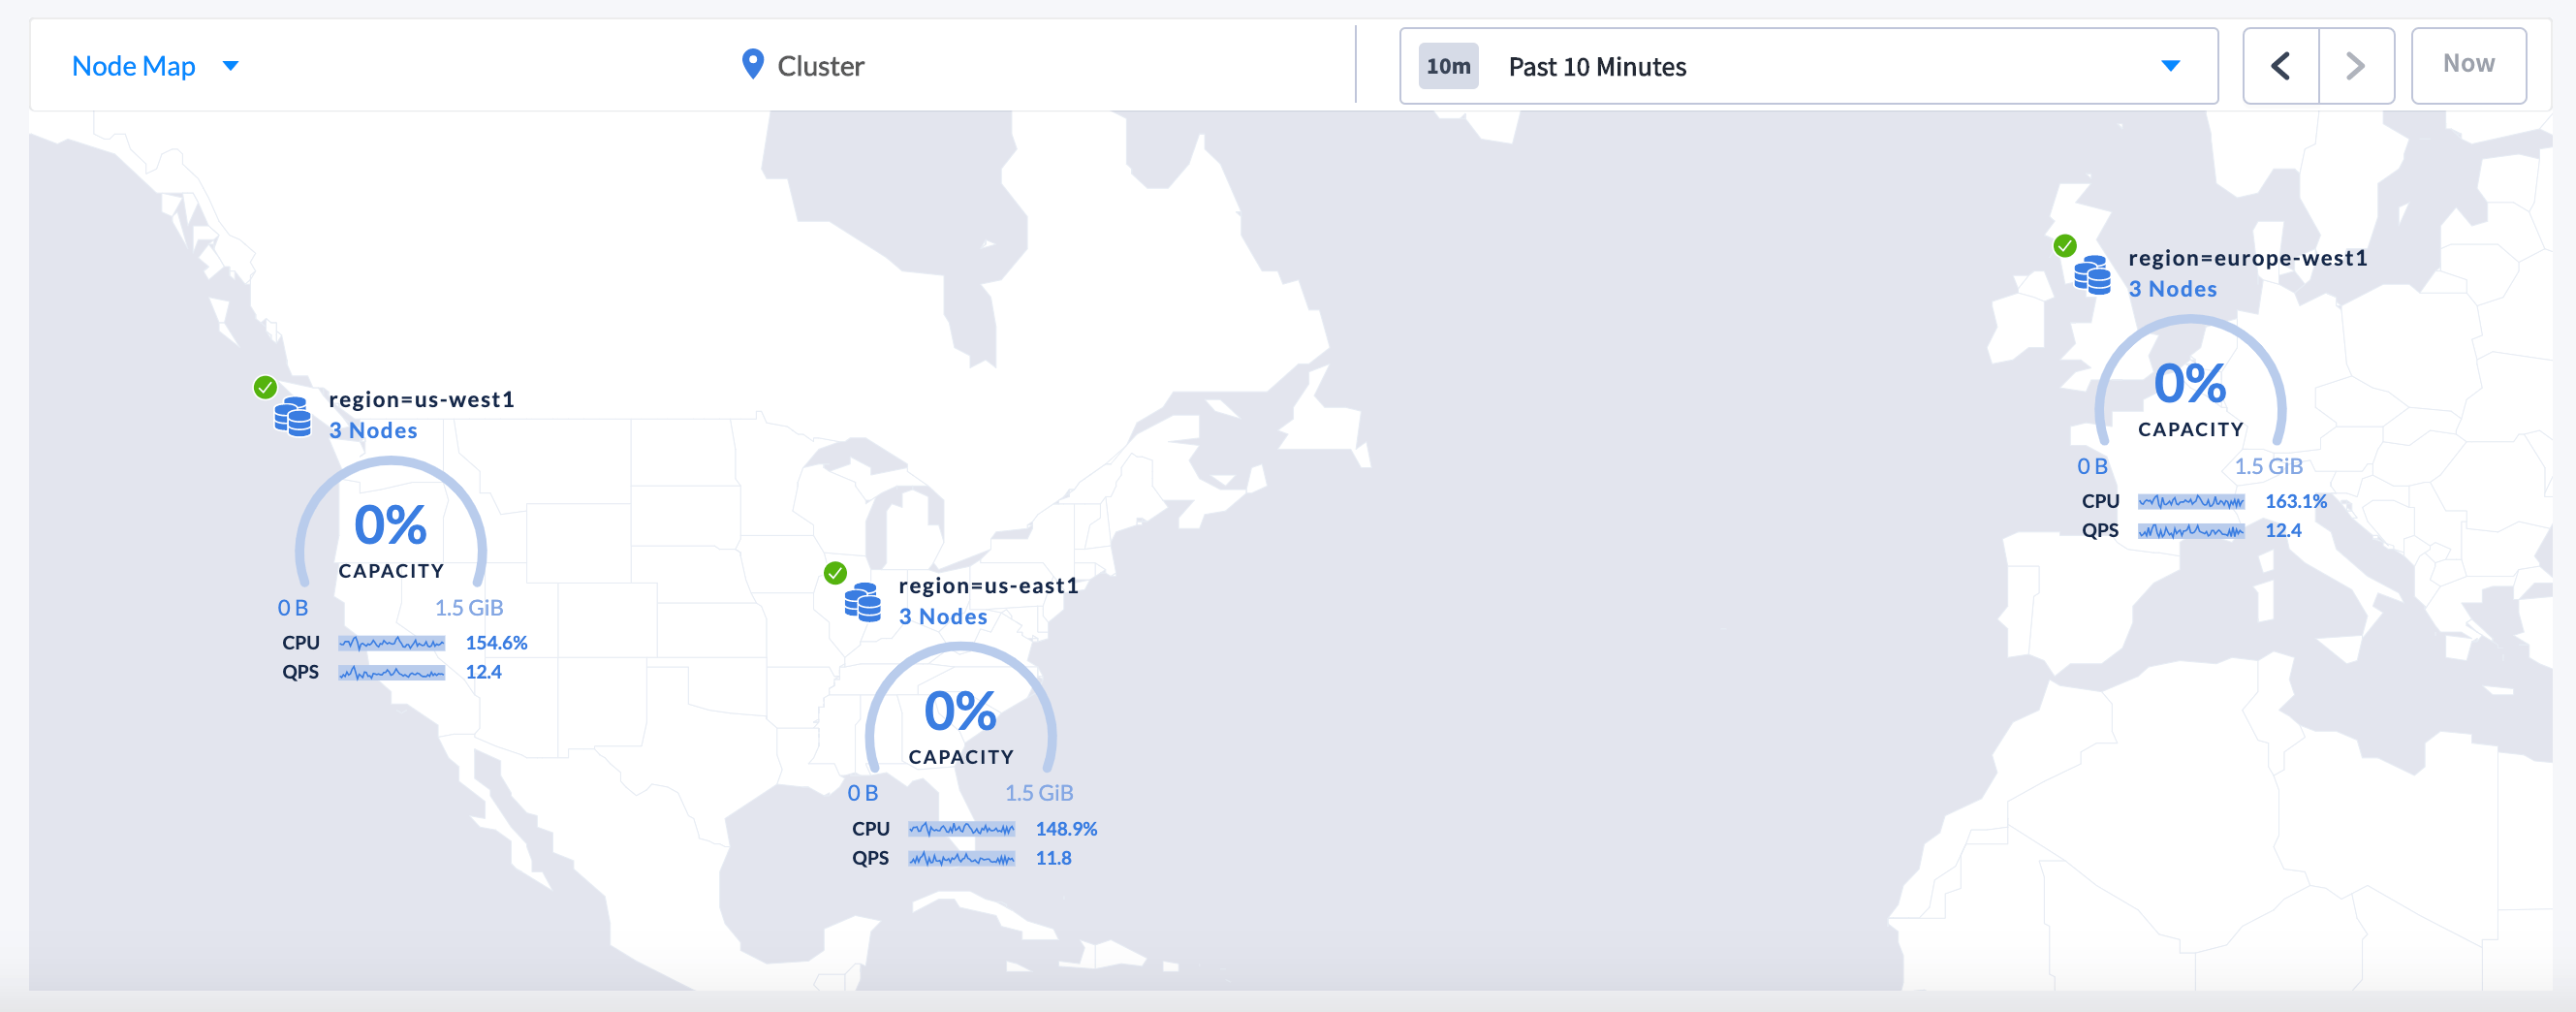
Locality component
A locality component represents capacity, CPU, and QPS metrics for a given locality. The map shows the components for the highest-level locality tier (e.g., region). You can click on the Node Count of a locality component to view any lower-level localities (e.g., availability zone). For details on how Capacity Usage is calculated, see Capacity metrics.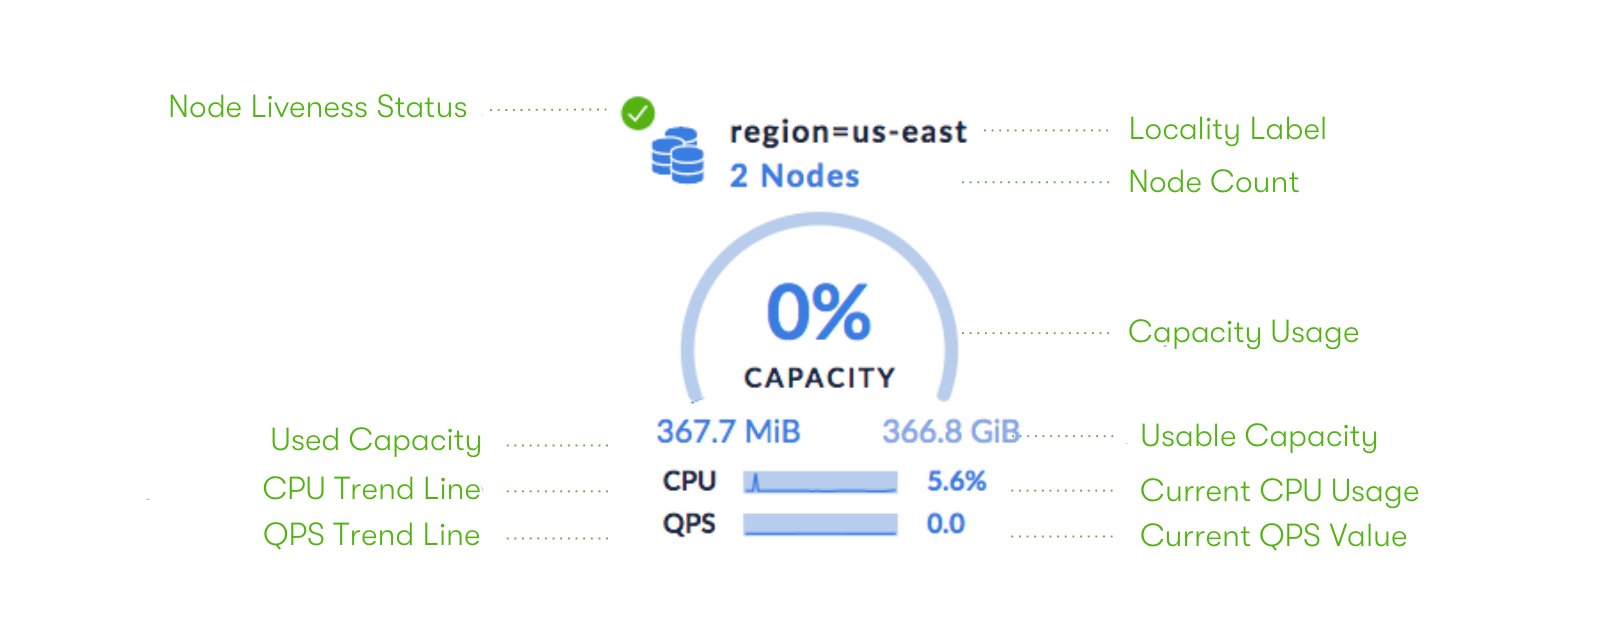
On multi-core systems, the displayed CPU usage can be greater than 100%. Full utilization of 1 core is considered as 100% CPU usage. If you have n cores, then CPU usage can range from 0% (indicating an idle system) to (n * 100)% (indicating full utilization).
Node component
A node component represents capacity, CPU, and QPS metrics for a given node. Node components are accessed by clicking on the Node Count of the lowest-level locality component. For details on how Capacity Usage is calculated, see Capacity metrics.