
On a , you must be an or a SQL user with the or (or the legacy
VIEWACTIVITY ). Other users will see only their own sessions. Refer to .Sessions table
Use the Sessions table to see active, idle, and closed sessions. A session is active if it has an open transaction (including implicit transactions, which are individual SQL statements), and idle if it has no open transaction. Active sessions consume hardware resources. A session is closed if it has closed the connection to CockroachDB.
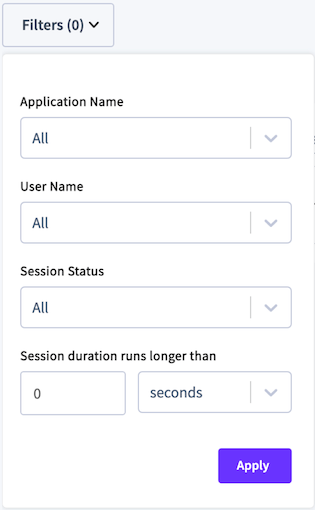
- To filter by , select Application Name and choose one or more applications.
- Queries from the SQL shell are displayed under the
$ cockroachapp. - If you have not set
application_namein a client connection string, it appears asunset.
- Queries from the SQL shell are displayed under the
- To filter by username or session status, select User Name or Session Status and check one or more checkboxes.
- To filter by session duration, specify the session time and unit.
To view details of a session, click a Session Start Time (UTC) to display session details.
Session Details
If a session is idle, the Transaction and Most Recent Statement panels will display No Active [Transaction | Statement].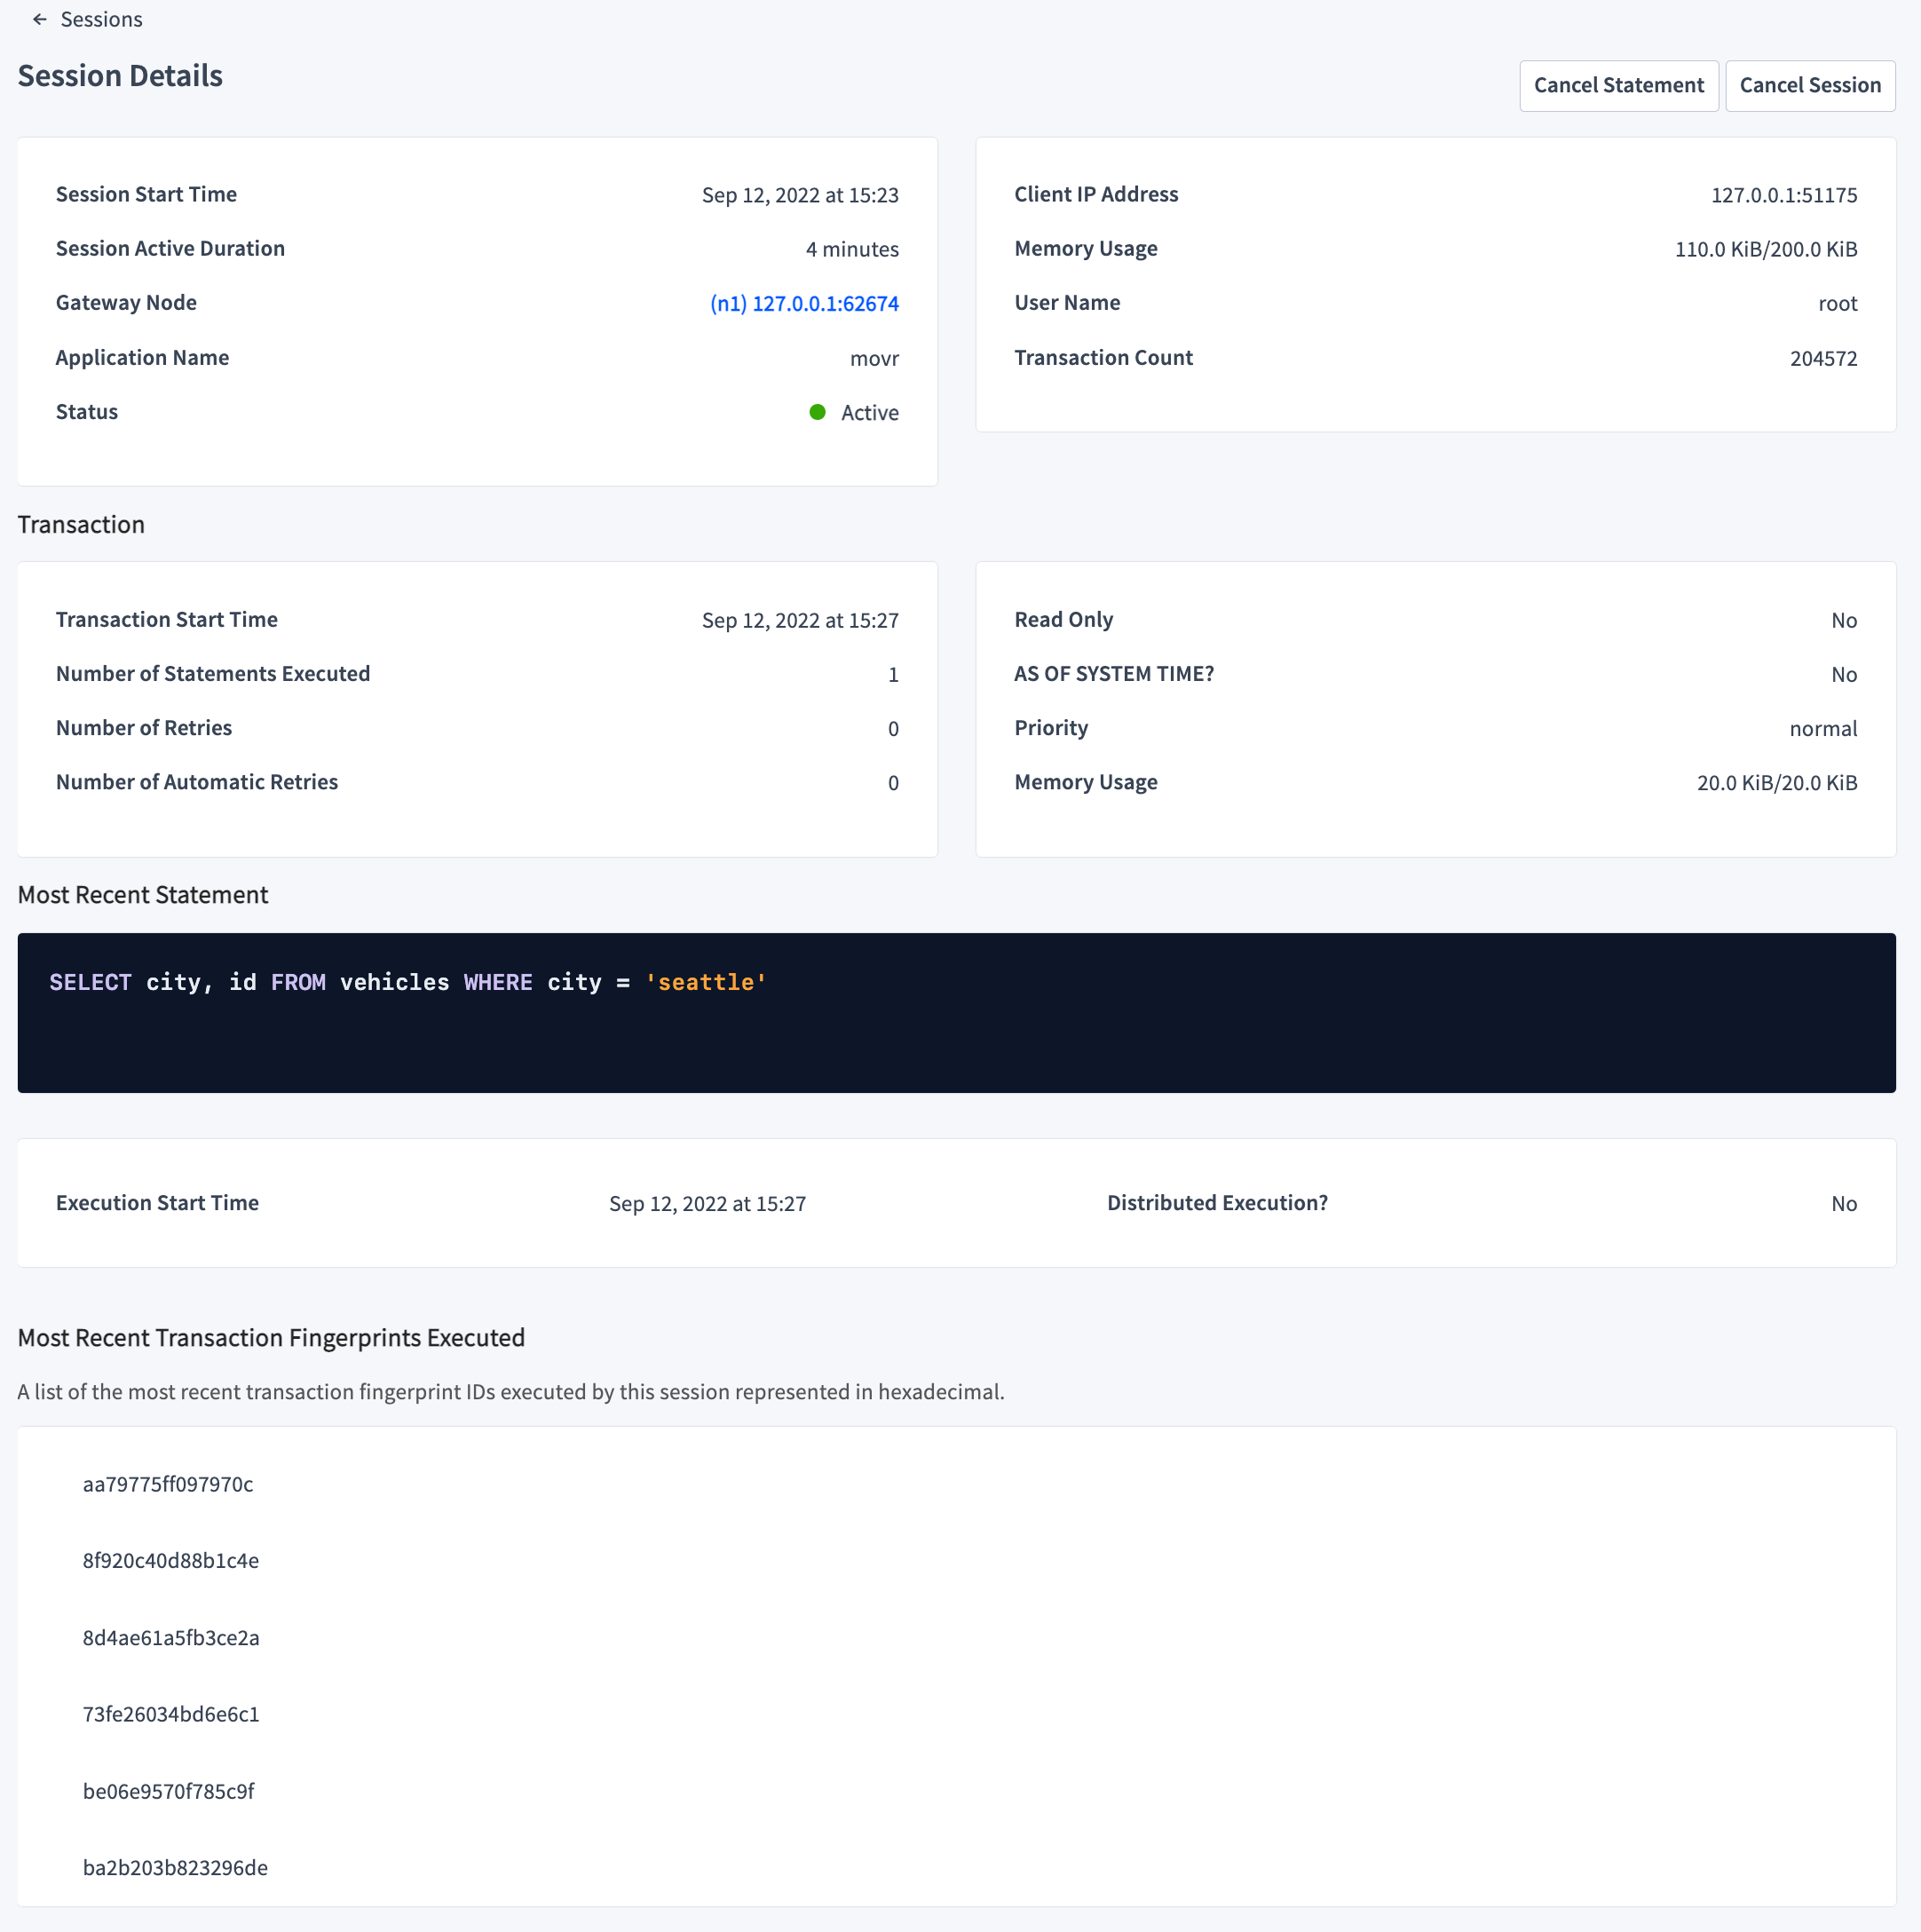
- Session Details
- Session Start Time shows the timestamp at which the session started. - Gateway Node shows the node ID and IP address/port of the node handling the client connection.
- Application Name shows the name of the application connected to the session.
- Client IP Address shows the IP address/port of the client that opened the session.
- Memory Usage shows the amount of memory currently allocated to this session, followed by the maximum amount of memory this session has ever allocated.
- User Name displays the name of the user that started the session.
- Transaction displays the following information for an open transaction.
- Transaction Start Time shows the timestamp at which the transaction started.
- Number of Statements Executed shows the total number of SQL statements executed by the transaction.
- Number of Retries shows the total number of for the transaction.
- Number of Automatic Retries shows the total number of run by CockroachDB for the transaction.
- Read Only? shows whether the transaction is read-only.
- AS OF SYSTEM TIME? shows whether the transaction uses to return historical data.
- Priority shows the for the transaction.
- Memory Usage shows the amount of memory currently allocated to this transaction, followed by the maximum amount of memory this transaction has ever allocated.
- Most Recent Statement displays the following information for an active statement.
- The SQL statement.
- Execution Start Time is the timestamp at which the statement was run.
- Distributed Execution? shows whether the statement uses optimization.
- Most Recent Transaction Fingerprints Executed
Closed session cache
Details about closed sessions are stored in memory in a closed session cache. This cache is controlled by the following two :- is the maximum number of sessions in the cache and defaults to
1000. Once this limit is reached, older sessions are deleted from the cache so newer sessions can be included. - is the maximum time to live, in seconds, and defaults to
3600. 60 minutes after a session is closed, it is deleted from the cache.
Unable to find session for a closed session, the details may no longer be available because they were removed from this cache according to the previously mentioned cluster settings.