

This article assumes you have already .
This page describes a Kubernetes deployment method that is considered “legacy” and will not be supported in a future release of CockroachDB. New CockroachDB deployments on Kubernetes are recommended to use the newer, fully-featured that’s easier to deploy and supports scaling of multi-region clusters. To migrate an existing deployment to use the CockroachDB operator, read the and migration guides.For more information on legacy Kubernetes deployments and support timelines, read the .
All
kubectl steps should be performed in the . By default, this is cockroach-operator-system.Configure Prometheus
Every node of a CockroachDB cluster exports granular timeseries metrics formatted for easy integration with Prometheus, an open source tool for storing, aggregating, and querying timeseries data. This section shows you how to orchestrate Prometheus as part of your Kubernetes cluster and pull these metrics into Prometheus for external monitoring. This guidance is based on CoreOS’s Prometheus Operator, which allows a Prometheus instance to be managed using built-in Kubernetes concepts.If you’re on Hosted GKE, before starting, make sure the email address associated with your Google Cloud account is part of the
cluster-admin RBAC group, as shown in .-
From your local workstation, edit the
cockroachdbservice to add theprometheus: cockroachdblabel:This ensures that only thecockroachdb(not thecockroach-publicservice) is being monitored by a Prometheus job. -
Determine the latest version of CoreOS’s Prometheus Operator and run the following to download and apply the latest
bundle.yamldefinition file:
Be sure to specify the latest CoreOS Prometheus Operator version in the following command, in place of this example’s use of version
v0.58.0.-
Confirm that the
prometheus-operatorhas started: -
Download our Prometheus manifest:
By default, this manifest uses the secret name generated by the Public operator. If you generated your own certificates and keys when , be sure that
ca.secret.namematches the name of the node secret you created. -
Apply the Prometheus manifest. This creates the various objects necessary to run a Prometheus instance:
-
Access the Prometheus UI locally and verify that CockroachDB is feeding data into Prometheus:
-
Port-forward from your local machine to the pod running Prometheus:
- Go to http://localhost:9090 in your browser.
-
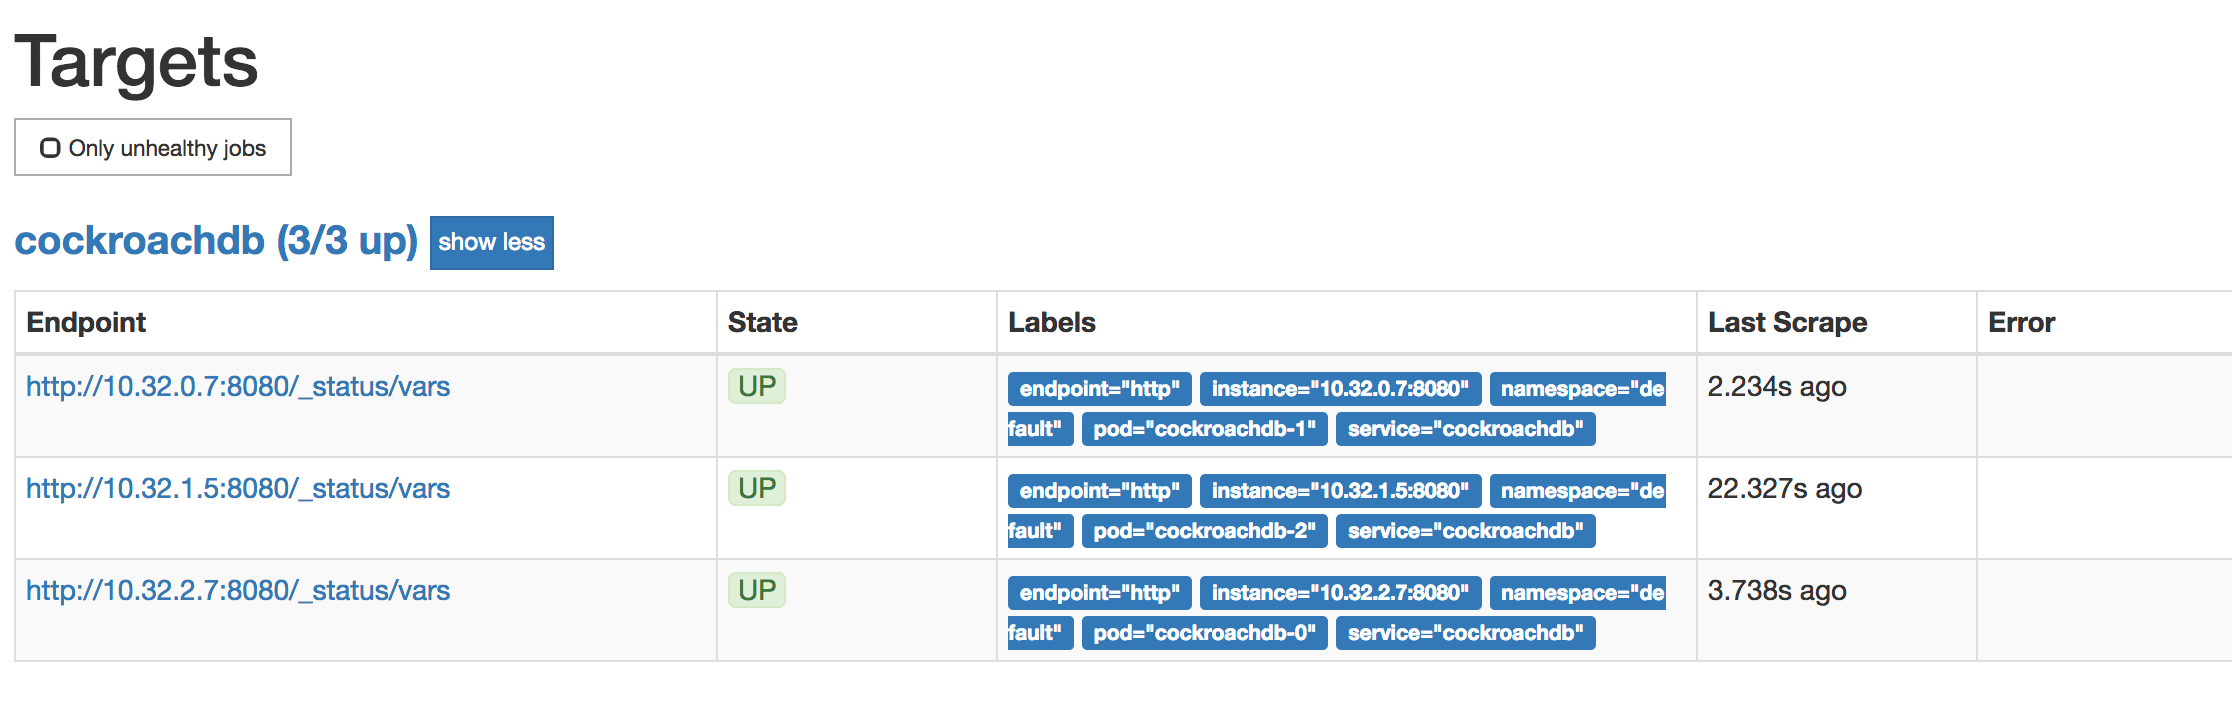
To verify that each CockroachDB node is connected to Prometheus, go to Status > Targets. The screen should look like this:
-
To verify that data is being collected, go to Graph, enter the
sys_uptimevariable in the field, click Execute, and then click the Graph tab. The screen should like this: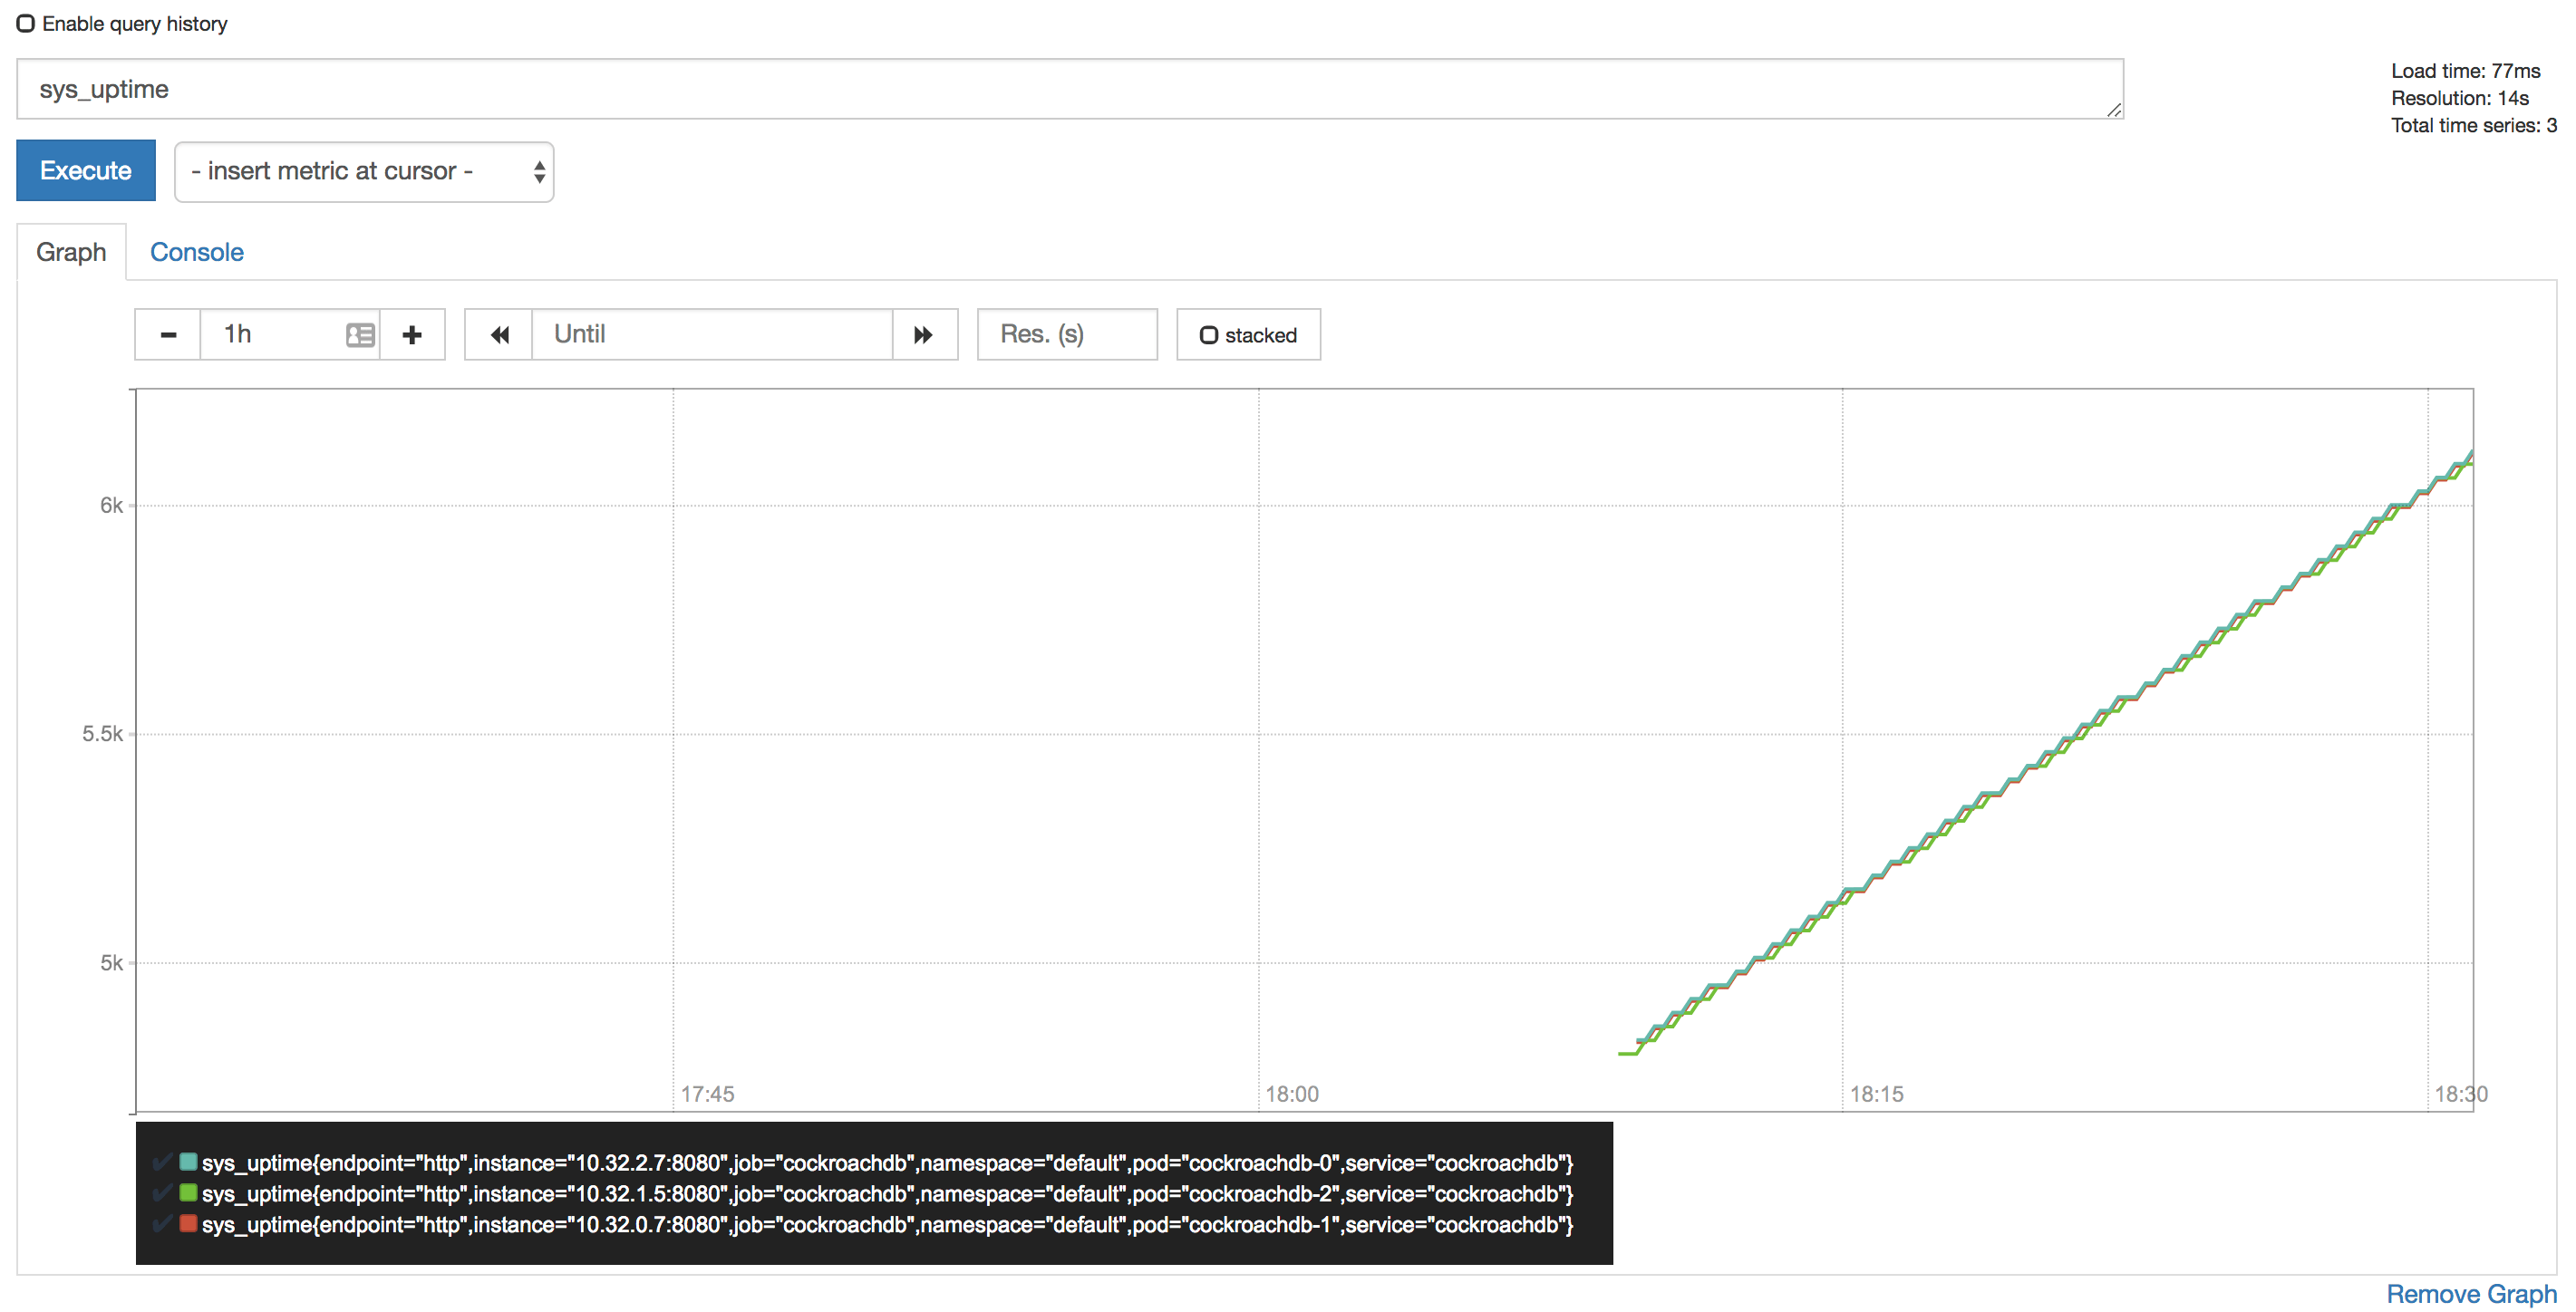
-
Port-forward from your local machine to the pod running Prometheus:
Configure Alertmanager
Active monitoring helps you spot problems early, but it is also essential to send notifications when there are events that require investigation or intervention. This section shows you how to use Alertmanager and CockroachDB’s starter to do this.-
Download our
alertmanager-config.yamlconfiguration file: -
Edit the
alertmanager-config.yamlfile to specify the desired receivers for notifications. Initially, the file contains a placeholder web hook. -
Add this configuration to the Kubernetes cluster as a secret, renaming it to
alertmanager.yamland labelling it to make it easier to find:
The name of the secret,
alertmanager-cockroachdb, must match the name used in the alertmanager.yaml file. If they differ, the Alertmanager instance will start without configuration, and nothing will happen.-
Use our file to create the various objects necessary to run an Alertmanager instance, including a ClusterIP service so that Prometheus can forward alerts:
-
Verify that Alertmanager is running:
-
Port-forward from your local machine to the pod running Alertmanager:
-
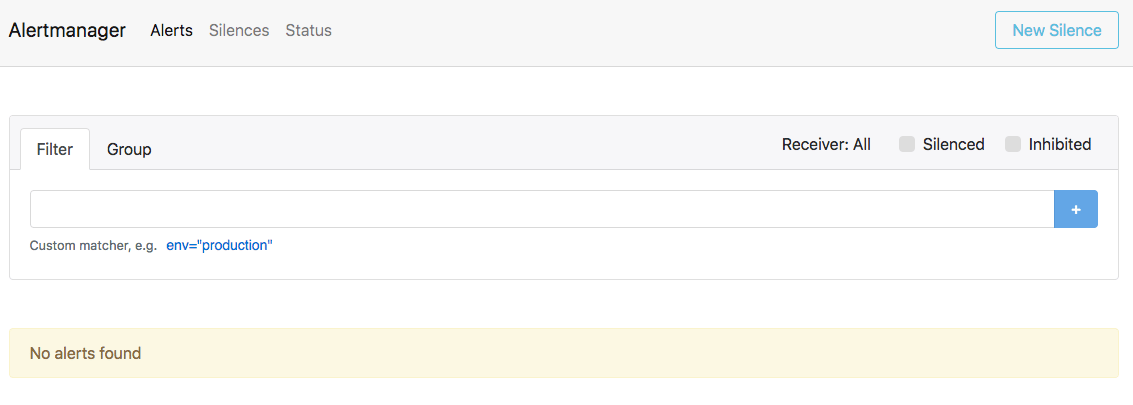
Go to http://localhost:9093 in your browser. The screen should look like this:
-
Port-forward from your local machine to the pod running Alertmanager:
-
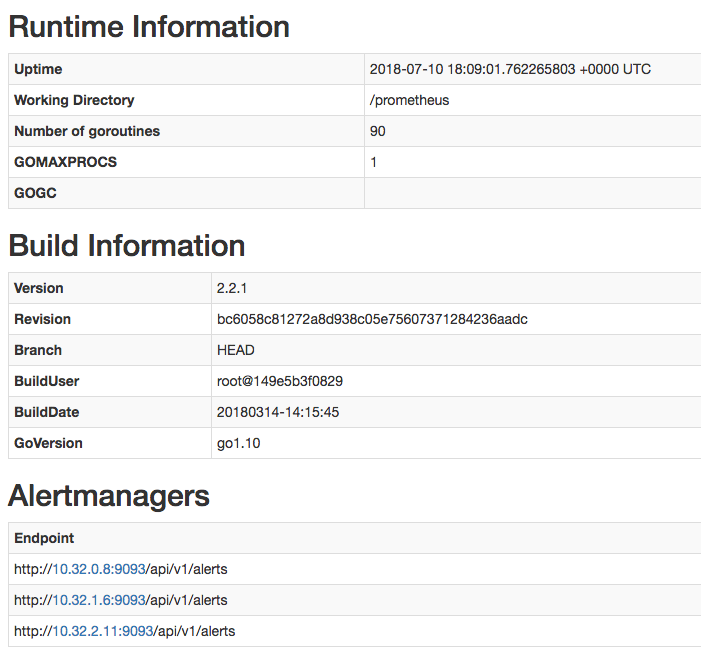
Ensure that the Alertmanagers are visible to Prometheus by opening http://localhost:9090/status. The screen should look like this:
-
Add CockroachDB’s starter :
-
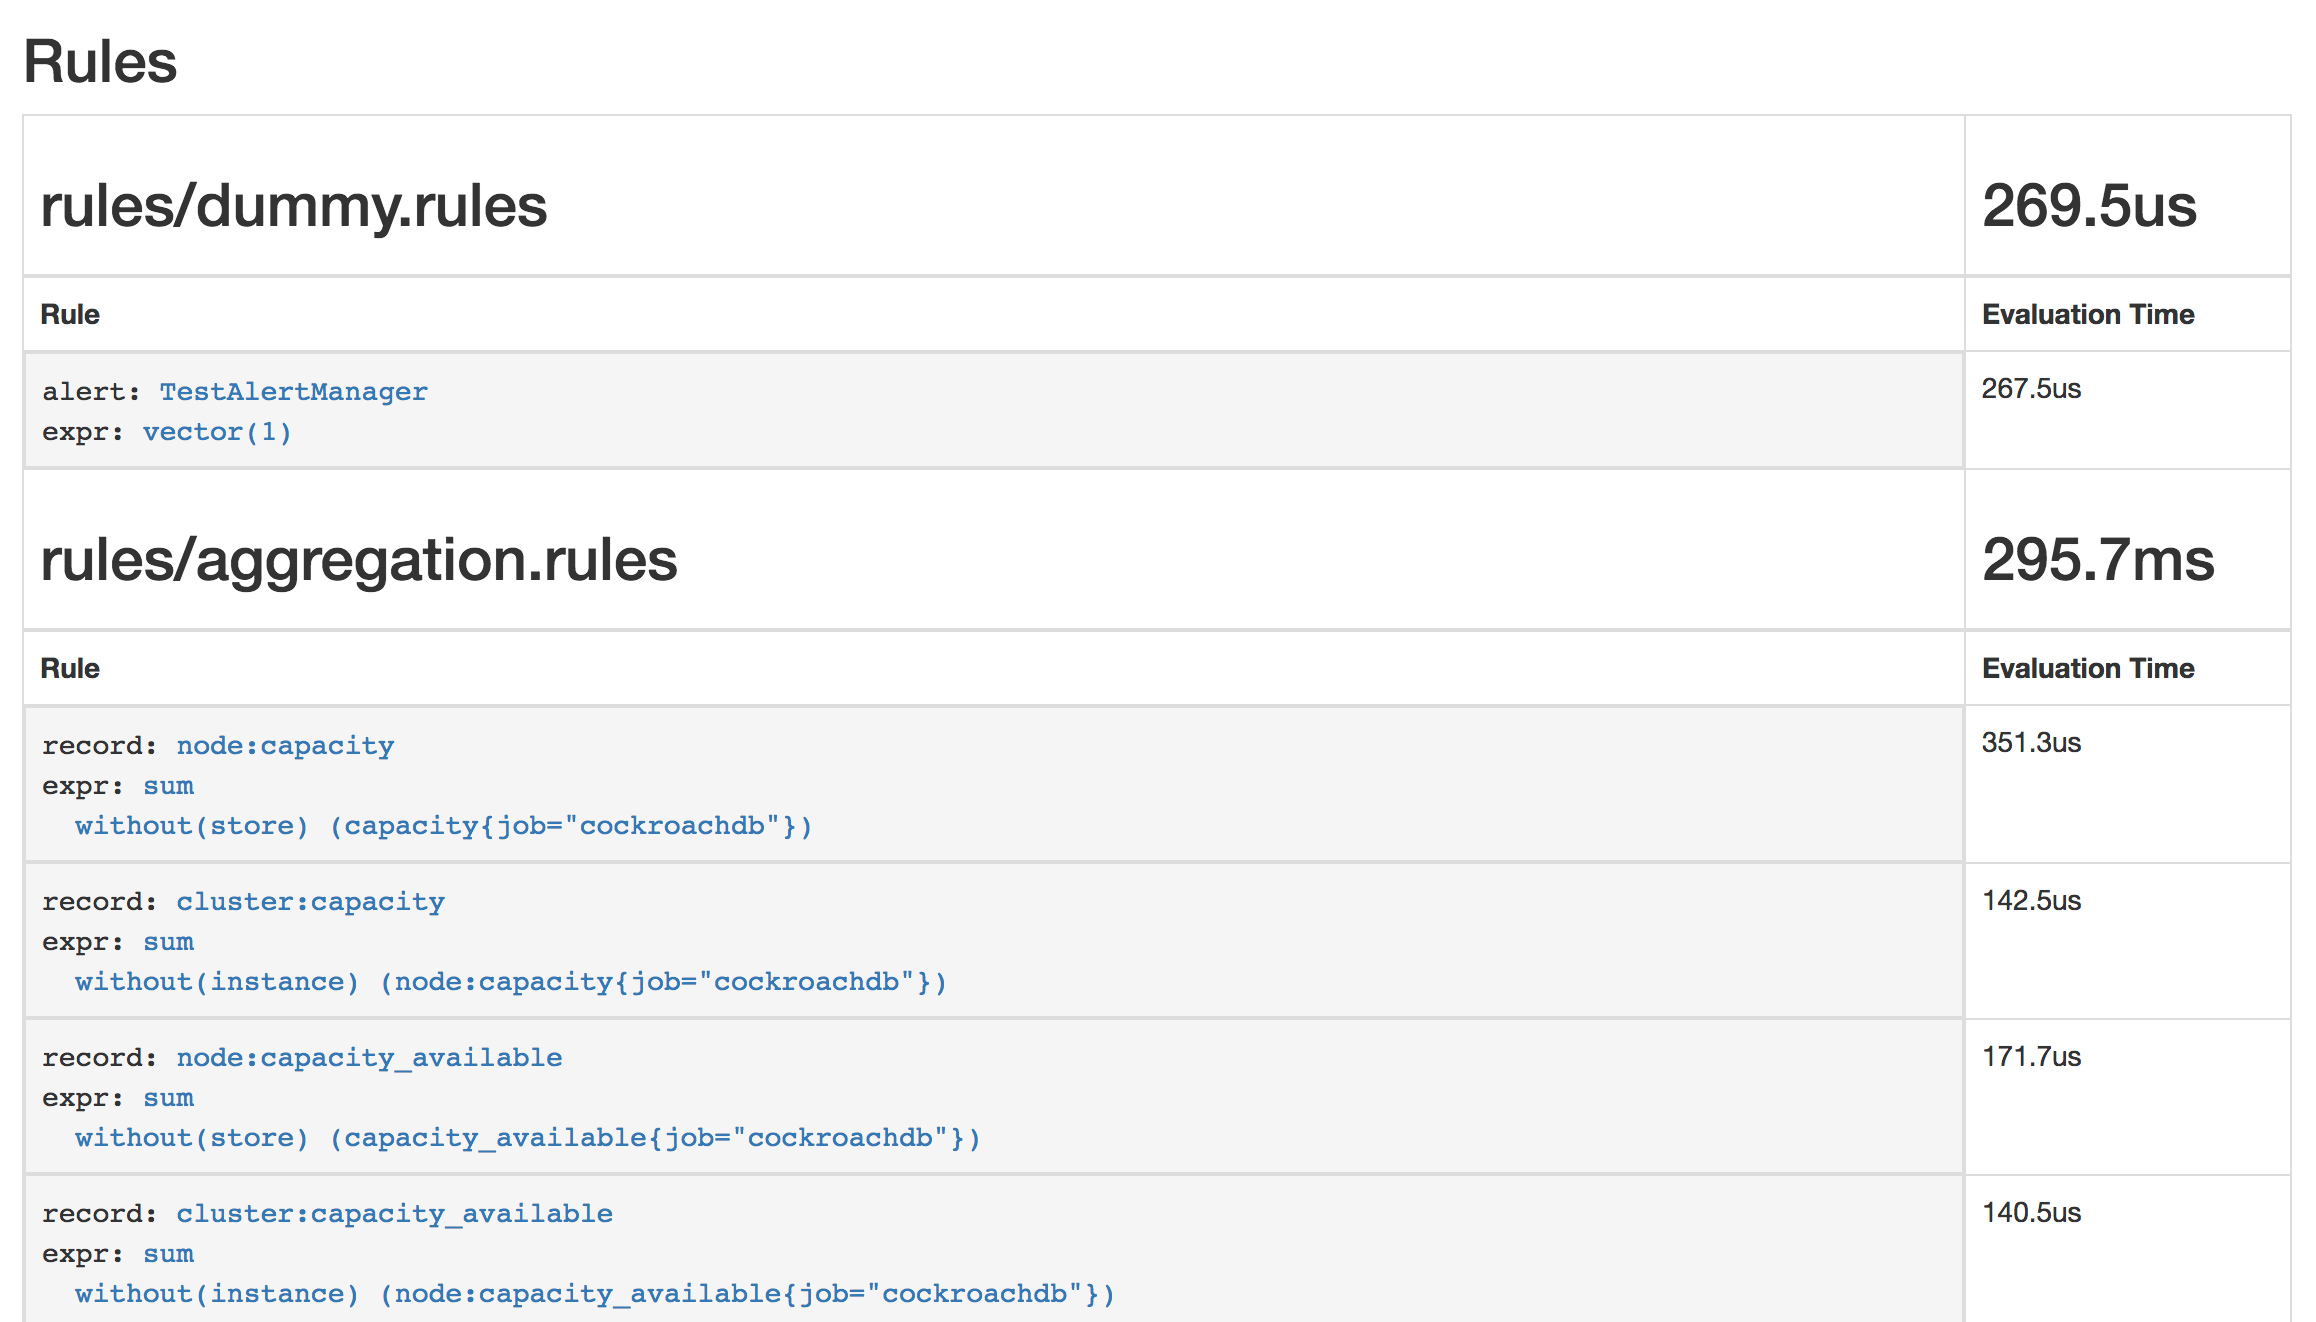
Ensure that the rules are visible to Prometheus by opening http://localhost:9090/rules. The screen should look like this:
-
Verify that the
TestAlertManagerexample alert is firing by opening http://localhost:9090/alerts. The screen should look like this: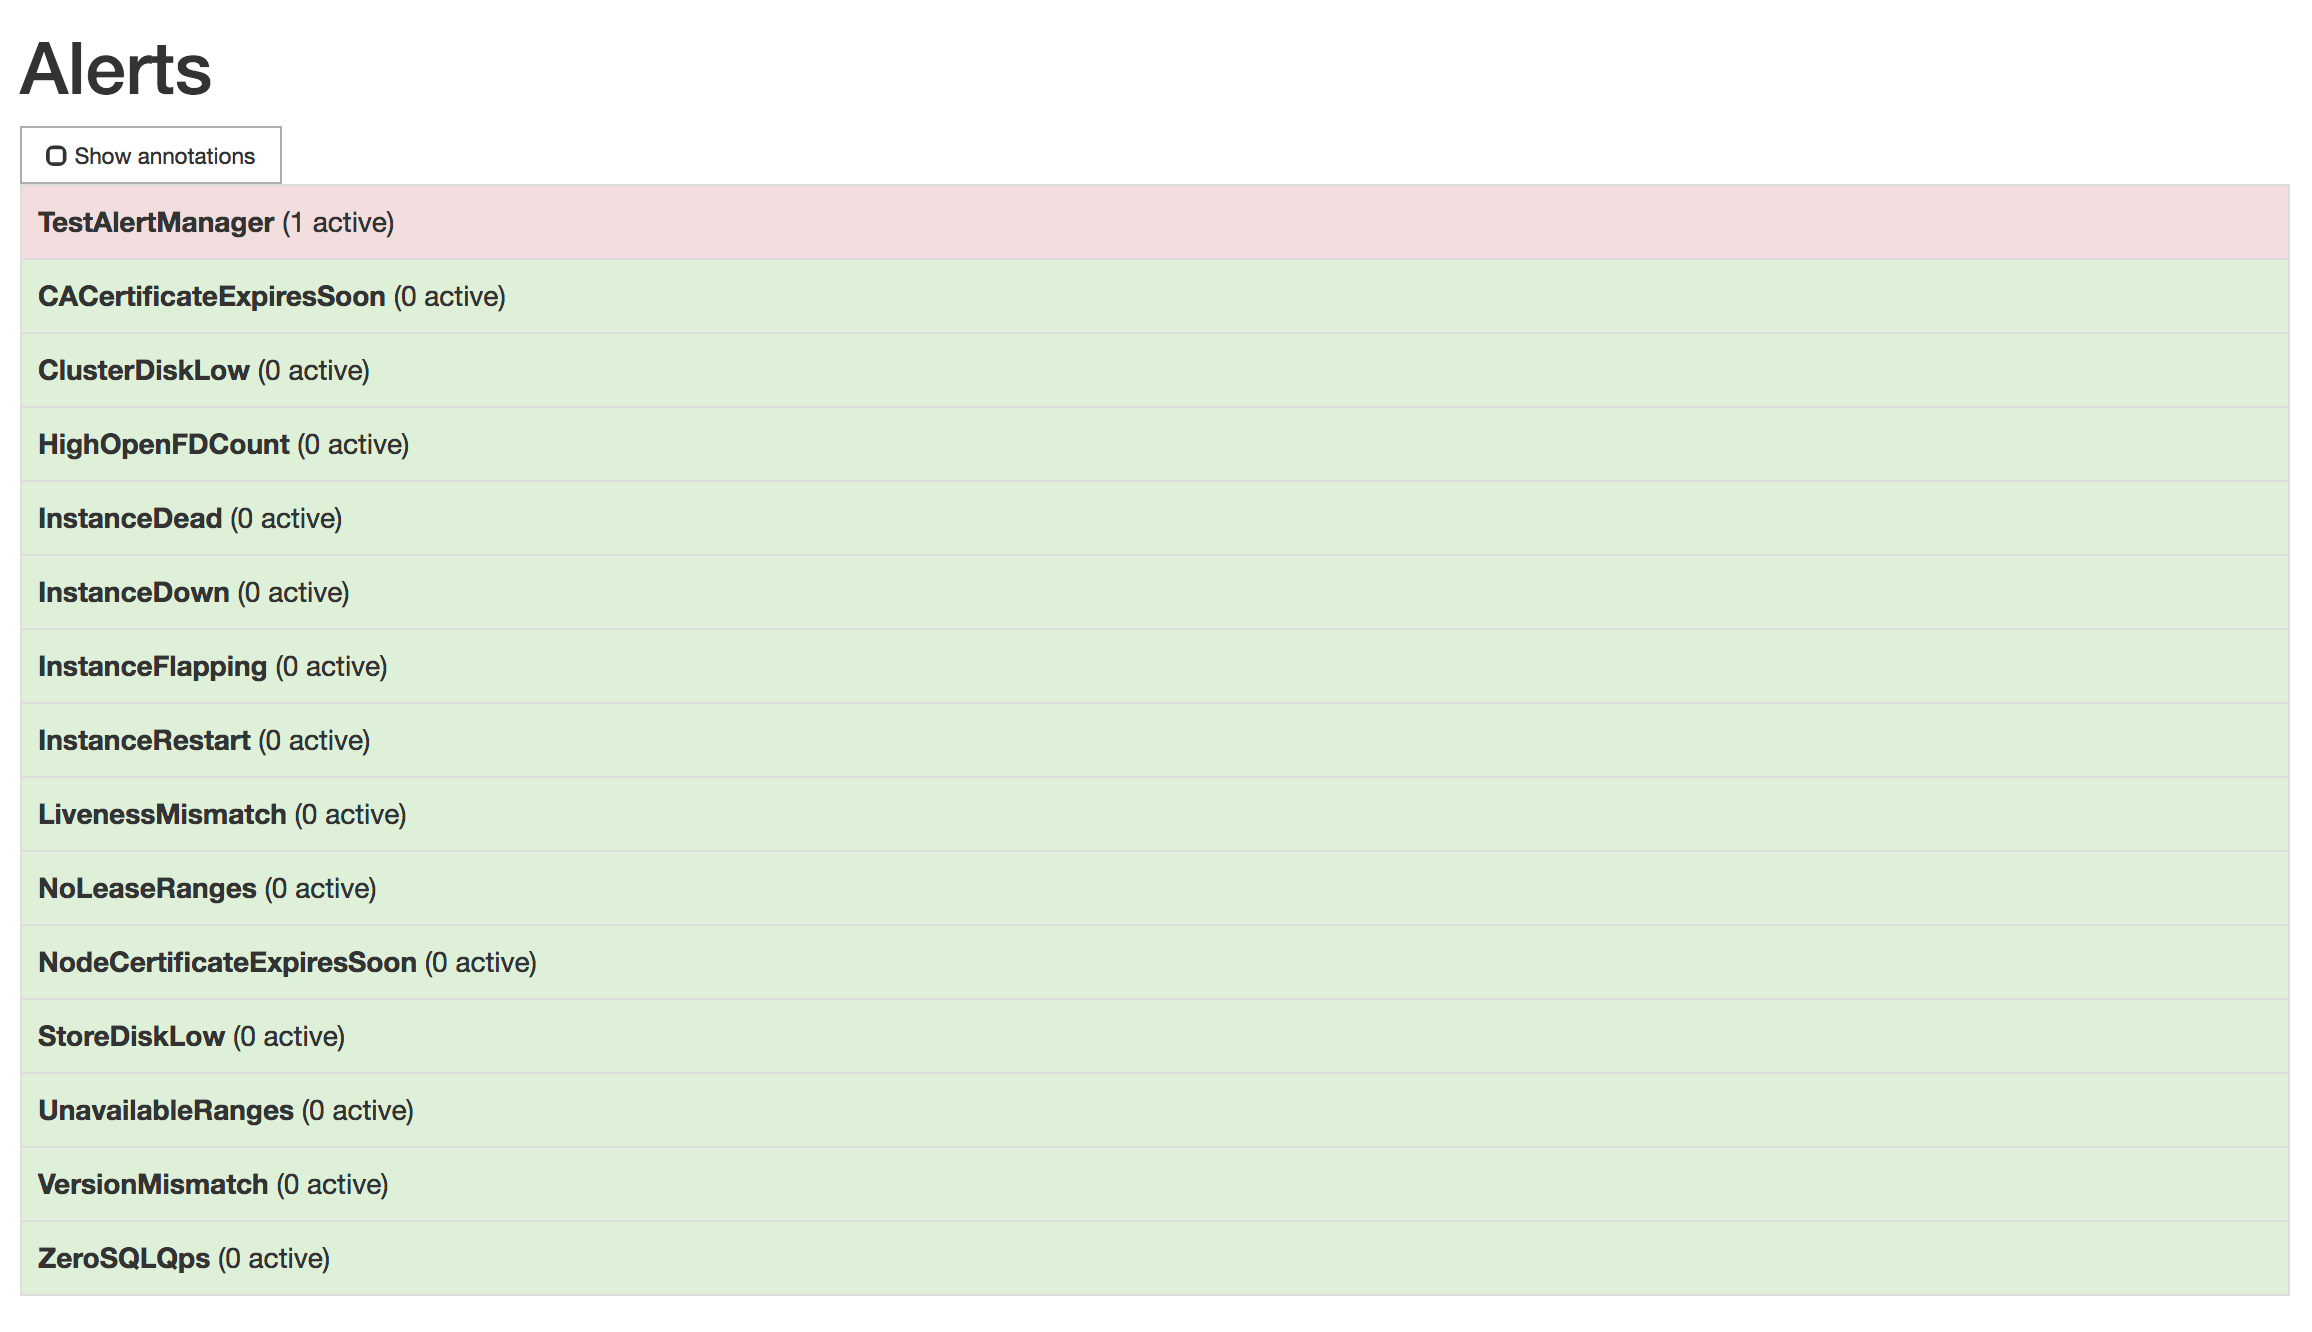
-
To remove the example alert:
-
Use the
kubectl editcommand to open the rules for editing: -
Remove the
dummy.rulesblock and save the file:
-
Use the
Configure logging
When running CockroachDB v21.1 and later, you can use the Public operator to configure the CockroachDB logging system. This allows you to output logs to such as file or network logging destinations.By default, Kubernetes deployments running CockroachDB v20.2 or earlier output all logs to
stderr.logging.yaml. For example:
- Save debug-level logs (the
DEV) to disk for troubleshooting. - Send operational- and security-level logs to a , in this case .
name must match the logConfigMap object of the Public operator’s custom resource, which is used to :
cockroach-stderr.log file.
Example: Creating a troubleshooting log file on pods
In this example, CockroachDB has already been deployed on a Kubernetes cluster. We override the to output logs to acockroach-dev.log file.
-
Create a ConfigMap named
logconfig. Note thatnamespaceis set to the Public operator’s default namespace (cockroach-operator-system):For simplicity, also name the YAML filelogconfig.yaml.
The ConfigMap key is not related to the ConfigMap
name or YAML filename, and must be named logging.yaml.DEV logs that have severity to a cockroach-dev.log file on each pod.
-
Apply the ConfigMap to the cluster:
-
Add the
nameof the ConfigMap inlogConfigMapto the : -
Apply the new settings to the cluster:
The changes will be rolled out to each pod.
-
See the log files available on a pod:
-
View a specific log file:
Configure Prometheus
Every node of a CockroachDB cluster exports granular timeseries metrics formatted for easy integration with Prometheus, an open source tool for storing, aggregating, and querying timeseries data. This section shows you how to orchestrate Prometheus as part of your Kubernetes cluster and pull these metrics into Prometheus for external monitoring. This guidance is based on CoreOS’s Prometheus Operator, which allows a Prometheus instance to be managed using built-in Kubernetes concepts. If you’re on Hosted GKE, before starting, make sure the email address associated with your Google Cloud account is part of thecluster-admin RBAC group, as shown in .
-
From your local workstation, edit the
cockroachdbservice to add theprometheus: cockroachdblabel:This ensures that only thecockroachdb(not thecockroach-publicservice) is being monitored by a Prometheus job. -
Determine the latest version of CoreOS’s Prometheus Operator and run the following to download and apply the latest
bundle.yamldefinition file: Be sure to specify the latest CoreOS Prometheus Operator version in the following command, in place of this example’s use of versionv0.58.0. -
Confirm that the
prometheus-operatorhas started: -
Download our Prometheus manifest:
By default, this manifest uses the secret name generated by the Public operator. If you generated your own certificates and keys when , be sure that
ca.secret.namematches the name of the node secret you created. -
Apply the Prometheus manifest. This creates the various objects necessary to run a Prometheus instance:
-
Access the Prometheus UI locally and verify that CockroachDB is feeding data into Prometheus:
-
Port-forward from your local machine to the pod running Prometheus:
- Go to http://localhost:9090 in your browser.
-
To verify that each CockroachDB node is connected to Prometheus, go to Status > Targets. The screen should look like this:
-
To verify that data is being collected, go to Graph, enter the
sys_uptimevariable in the field, click Execute, and then click the Graph tab. The screen should like this:
-
Port-forward from your local machine to the pod running Prometheus:
Configure Alertmanager
Active monitoring helps you spot problems early, but it is also essential to send notifications when there are events that require investigation or intervention. This section shows you how to use Alertmanager and CockroachDB’s starter to do this.-
Download our
alertmanager-config.yamlconfiguration file: -
Edit the
alertmanager-config.yamlfile to specify the desired receivers for notifications. Initially, the file contains a placeholder web hook. -
Add this configuration to the Kubernetes cluster as a secret, renaming it to
alertmanager.yamland labelling it to make it easier to find:The name of the secret,alertmanager-cockroachdb, must match the name used in thealertmanager.yamlfile. If they differ, the Alertmanager instance will start without configuration, and nothing will happen. -
Use our file to create the various objects necessary to run an Alertmanager instance, including a ClusterIP service so that Prometheus can forward alerts:
-
Verify that Alertmanager is running:
-
Port-forward from your local machine to the pod running Alertmanager:
-
Go to http://localhost:9093 in your browser. The screen should look like this:
-
Port-forward from your local machine to the pod running Alertmanager:
-
Ensure that the Alertmanagers are visible to Prometheus by opening http://localhost:9090/status. The screen should look like this:
-
Add CockroachDB’s starter :
-
Ensure that the rules are visible to Prometheus by opening http://localhost:9090/rules. The screen should look like this:
-
Verify that the
TestAlertManagerexample alert is firing by opening http://localhost:9090/alerts. The screen should look like this: -
To remove the example alert:
-
Use the
kubectl editcommand to open the rules for editing: -
Remove the
dummy.rulesblock and save the file:
-
Use the
Configure Prometheus
Every node of a CockroachDB cluster exports granular timeseries metrics formatted for easy integration with Prometheus, an open source tool for storing, aggregating, and querying timeseries data. This section shows you how to orchestrate Prometheus as part of your Kubernetes cluster and pull these metrics into Prometheus for external monitoring. This guidance is based on CoreOS’s Prometheus Operator, which allows a Prometheus instance to be managed using built-in Kubernetes concepts. If you’re on Hosted GKE, before starting, make sure the email address associated with your Google Cloud account is part of thecluster-admin RBAC group, as shown in .
-
From your local workstation, edit the
cockroachdbservice to add theprometheus: cockroachdblabel:This ensures that there is a Prometheus job and monitoring data only for themy-release-cockroachdbservice, not for themy-release-cockroach-publicservice. -
Determine the latest version of CoreOS’s Prometheus Operator and run the following to download and apply the latest
bundle.yamldefinition file: Be sure to specify the latest CoreOS Prometheus Operator version in the following command, in place of this example’s use of versionv0.58.0. -
Confirm that the
prometheus-operatorhas started: -
Download our Prometheus manifest:
By default, this manifest uses the secret name generated by the Public operator. If you generated your own certificates and keys when , be sure that
ca.secret.namematches the name of the node secret you created. -
Apply the Prometheus manifest. This creates the various objects necessary to run a Prometheus instance:
-
Access the Prometheus UI locally and verify that CockroachDB is feeding data into Prometheus:
-
Port-forward from your local machine to the pod running Prometheus:
- Go to http://localhost:9090 in your browser.
-
To verify that each CockroachDB node is connected to Prometheus, go to Status > Targets. The screen should look like this:
-
To verify that data is being collected, go to Graph, enter the
sys_uptimevariable in the field, click Execute, and then click the Graph tab. The screen should like this:
-
Port-forward from your local machine to the pod running Prometheus:
Configure Alertmanager
Active monitoring helps you spot problems early, but it is also essential to send notifications when there are events that require investigation or intervention. This section shows you how to use Alertmanager and CockroachDB’s starter to do this.-
Download our
alertmanager-config.yamlconfiguration file: -
Edit the
alertmanager-config.yamlfile to specify the desired receivers for notifications. Initially, the file contains a placeholder web hook. -
Add this configuration to the Kubernetes cluster as a secret, renaming it to
alertmanager.yamland labelling it to make it easier to find:The name of the secret,alertmanager-cockroachdb, must match the name used in thealertmanager.yamlfile. If they differ, the Alertmanager instance will start without configuration, and nothing will happen. -
Use our file to create the various objects necessary to run an Alertmanager instance, including a ClusterIP service so that Prometheus can forward alerts:
-
Verify that Alertmanager is running:
-
Port-forward from your local machine to the pod running Alertmanager:
-
Go to http://localhost:9093 in your browser. The screen should look like this:
-
Port-forward from your local machine to the pod running Alertmanager:
-
Ensure that the Alertmanagers are visible to Prometheus by opening http://localhost:9090/status. The screen should look like this:
-
Add CockroachDB’s starter :
-
Ensure that the rules are visible to Prometheus by opening http://localhost:9090/rules. The screen should look like this:
-
Verify that the
TestAlertManagerexample alert is firing by opening http://localhost:9090/alerts. The screen should look like this: -
To remove the example alert:
-
Use the
kubectl editcommand to open the rules for editing: -
Remove the
dummy.rulesblock and save the file:
-
Use the