SHOW TRACE FOR SESSION returns details about how CockroachDB executed a statement or series of statements recorded during a session. These details include messages and timing information from all nodes involved in the execution, providing visibility into the actions taken by CockroachDB across all of its software layers.
You can use SHOW TRACE FOR SESSION to debug why a query is not performing as expected, to add more information to bug reports, or to generally learn more about how CockroachDB works.
A contains statement traces in plaintext, JSON, and format.
Usage overview
SHOW TRACE FOR SESSION returns statement traces for the most recently executed statements.
To start recording statement traces during a session, enable the tracing session variable via . To stop recording statement traces during a session, disable the tracing session variable via .
Recording statement traces during a session does not effect the logical execution of the statements. This means that errors encountered by statements during a recording are returned to clients. CockroachDB will individual statements (considered implicit transactions) and multi-statement transactions sent as a single batch when are encountered due to . Also, clients will receive retry errors required to handle . As a result, traces of all transaction retries will be captured during a recording.
Required privileges
ForSHOW TRACE FOR SESSION, no privileges are required.
Syntax

Parameters
Trace description
CockroachDB uses OpenTelemetry libraries for tracing, which also means that it can be easily integrated with OpenTelemetry-compatible . CockroachDB traces map to OpenTelemetry trace and span concepts as follows:
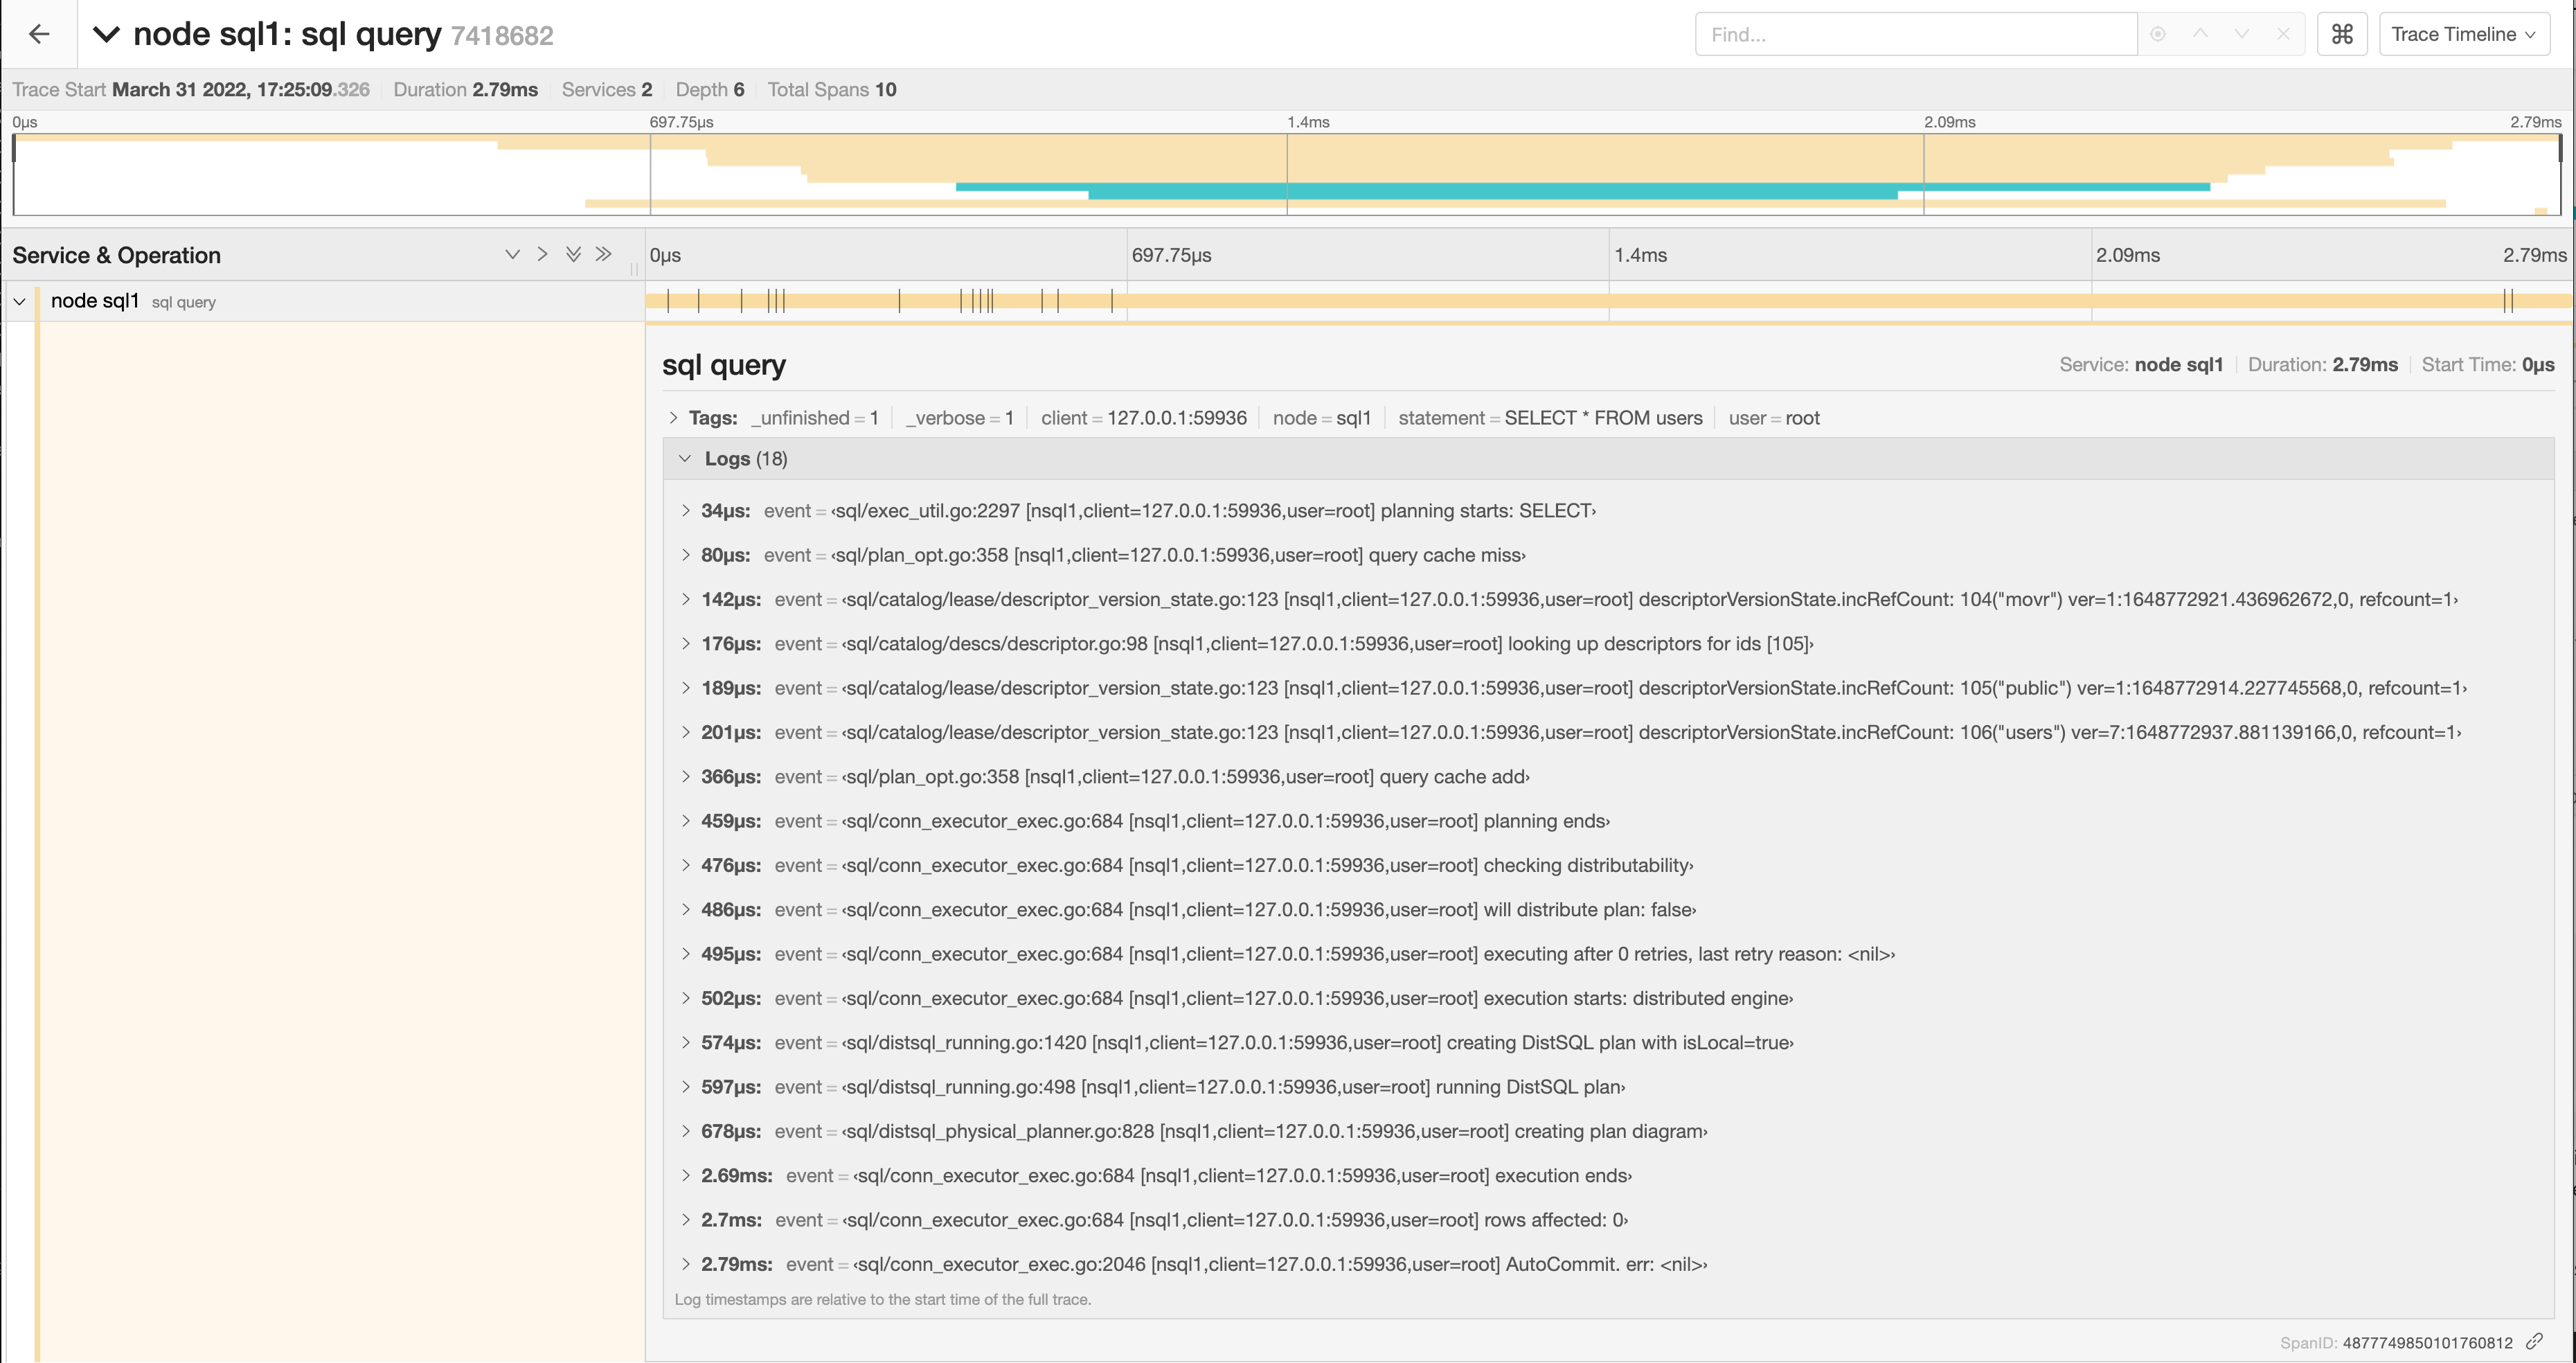
Consider a visualization of a trace for one statement as . The image shows spans and log messages. You can see names of operations and sub-operations, along with parent-child relationships and timing information, and it’s easy to see which operations are executed in parallel.
Response
The format of the
SHOW TRACE FOR SESSION response may change in future versions.=== SPAN START: <operation> === message) or a log message from a span. Rows are generally listed in their timestamp order (i.e., the order in which the events they represent occurred) with the exception that messages from child spans are interleaved in the parent span according to their timing. Messages from sibling spans, however, are not interleaved with respect to one another.
The following diagram shows the order in which messages from different spans would be interleaved in an example trace. Each box is a span; inner-boxes are child spans. The numbers indicate the order in which the log messages would appear in the virtual table.
If you specify the
COMPACT parameter, only the age, message, tag, and operation columns are returned. In addition, the value of the location column is prepended to message.
Examples
Trace a session
Trace conflicting transactions
This example uses two terminals concurrently to generate conflicting transactions.-
In terminal 1, create a table:
-
In terminal 1, open a transaction and perform a write without closing the transaction:
Press enter one more time to send these statements to the server.
-
In terminal 2, turn tracing on:
-
In terminal 2, execute a conflicting read:
You’ll see that this statement is blocked until the transaction in terminal 1 finishes.
-
In terminal 1, finish the transaction:
-
In terminal 2, you’ll see the completed read:
-
In terminal 2, stop tracing and then view the completed trace: