
EXPLAIN returns CockroachDB’s statement plan for a . You can use this information to optimize the query.
Query optimization
UsingEXPLAIN output, you can optimize your queries as follows:
- Restructure queries to require fewer levels of processing. Queries with fewer levels execute more quickly.
- Avoid scanning an entire table, which is the slowest way to access data. that contain at least one of the columns that the query is filtering in its
WHEREclause.
EXPLAIN to see which:
- Indexes the query uses; shown as the value of the
tableproperty. - Key values in the index are being scanned; shown as the value of the
spansproperty.
estimated row count property.
For more information about indexing and table scans, see Find the Indexes and Key Ranges a Query Uses.
Synopsis

Required privileges
The user requires the appropriate for the statement being explained.Parameters
Success responses
A successfulEXPLAIN statement returns a table with the following details in the info column:
Global properties
Statement plan tree properties
Examples
The following examples use the . Start the on a 3-node CockroachDB demo cluster with a larger data set.Default statement plans
By default,EXPLAIN includes the least detail about the statement plan but can be useful to find out which indexes and index key ranges are used by a query. For example:
sort, a filter, and a scan.
The output also describes a set of properties, some global to the query, some specific to an operation listed in the true structure (in this case, sort, filter, or scan), and an index recommendation:
-
distribution:fullThe planner chose a distributed execution plan, where execution of the query is performed by multiple nodes in parallel, then the results are returned by the gateway node. An execution plan withfulldistribution doesn’t process on all nodes in the cluster. It is executed simultaneously on multiple nodes. An execution plan withlocaldistribution is performed only on the gateway node. Even if the execution plan islocal, row data may be fetched from remote nodes, but the processing of the data is performed by the local node. -
vectorized:trueThe plan will be executed with the . -
order:+revenueThe sort will be ordered ascending on therevenuecolumn. -
filter:revenue > 90The scan filters on therevenuecolumn. -
estimated row count:125,000 (100% of the table; stats collected 19 minutes ago)The estimated number of rows scanned by the query, in this case,125,000rows of data; the percentage of the table the query spans, in this case 100%; and when the statistics for the table were last collected, in this case 19 minutes ago. If you do not see statistics, you can manually generate table statistics with or configure more frequent statistics generation following the steps in . -
table:rides@rides_pkeyThe table is scanned on therides_pkeyindex. -
spans:FULL SCANThe table is scanned on all key ranges of therides_pkeyindex (also known as a “full table scan” or “unlimited full scan”). For more information on indexes and key ranges, see the following example. -
index recommendations: 1The number of index recommendations, followed by the recommendation and statement. The recommendation to create an index on theridestable and thevehicle_city,rider_id,vehicle_id,start_address,end_address,start_time, andend_timecolumns will eliminate the full scan of theridestable. Index recommendations are displayed by default. To disable index recommendations, set theindex_recommendations_enabledtofalse.
EXPLAIN call demonstrates that the estimated row count is 10% of the table:
limit property:
Join queries
If you runEXPLAIN on a query, the output will display which type of join will be executed. For example, the following EXPLAIN output shows that the query will perform a :
Insert queries
EXPLAIN output for queries is similar to the output for standard SELECT queries. For example:
INSERT lists the primary operation (in this case, insert), and the table and columns affected by the operation in the into field (in this case, the id, city, name, address, and credit_card columns of the users table). The output also includes the size of the INSERT in the size field (in this case, 5 columns in a single row).
For more complex types of INSERT queries, EXPLAIN output can include more information. For example, suppose that you create a UNIQUE index on the users table:
EXPLAIN output for an , which inserts some data that might conflict with the UNIQUE constraint imposed on the name, city, and id columns, run:
INSERT includes an ON CONFLICT clause, the query requires more than a simple insert operation. CockroachDB must check the provided values against the values in the database, to ensure that the UNIQUE constraint on name, city, and id is not violated. The output also lists the indexes available to detect conflicts (the arbiter indexes), including the users_city_id_name_key index.
Alter queries
If you alter a table to split a range as described in , theEXPLAIN command returns the target table and index names and a NULL expiry timestamp:
EXPLAIN command returns the target table and index names and the expiry timestamp:
Options
VERBOSE option
The VERBOSE option includes:
- SQL expressions that are involved in each processing stage, providing more granular detail about which portion of your query is represented at each level.
- Detail about which columns are being used by each level, as well as properties of the result set on that level.
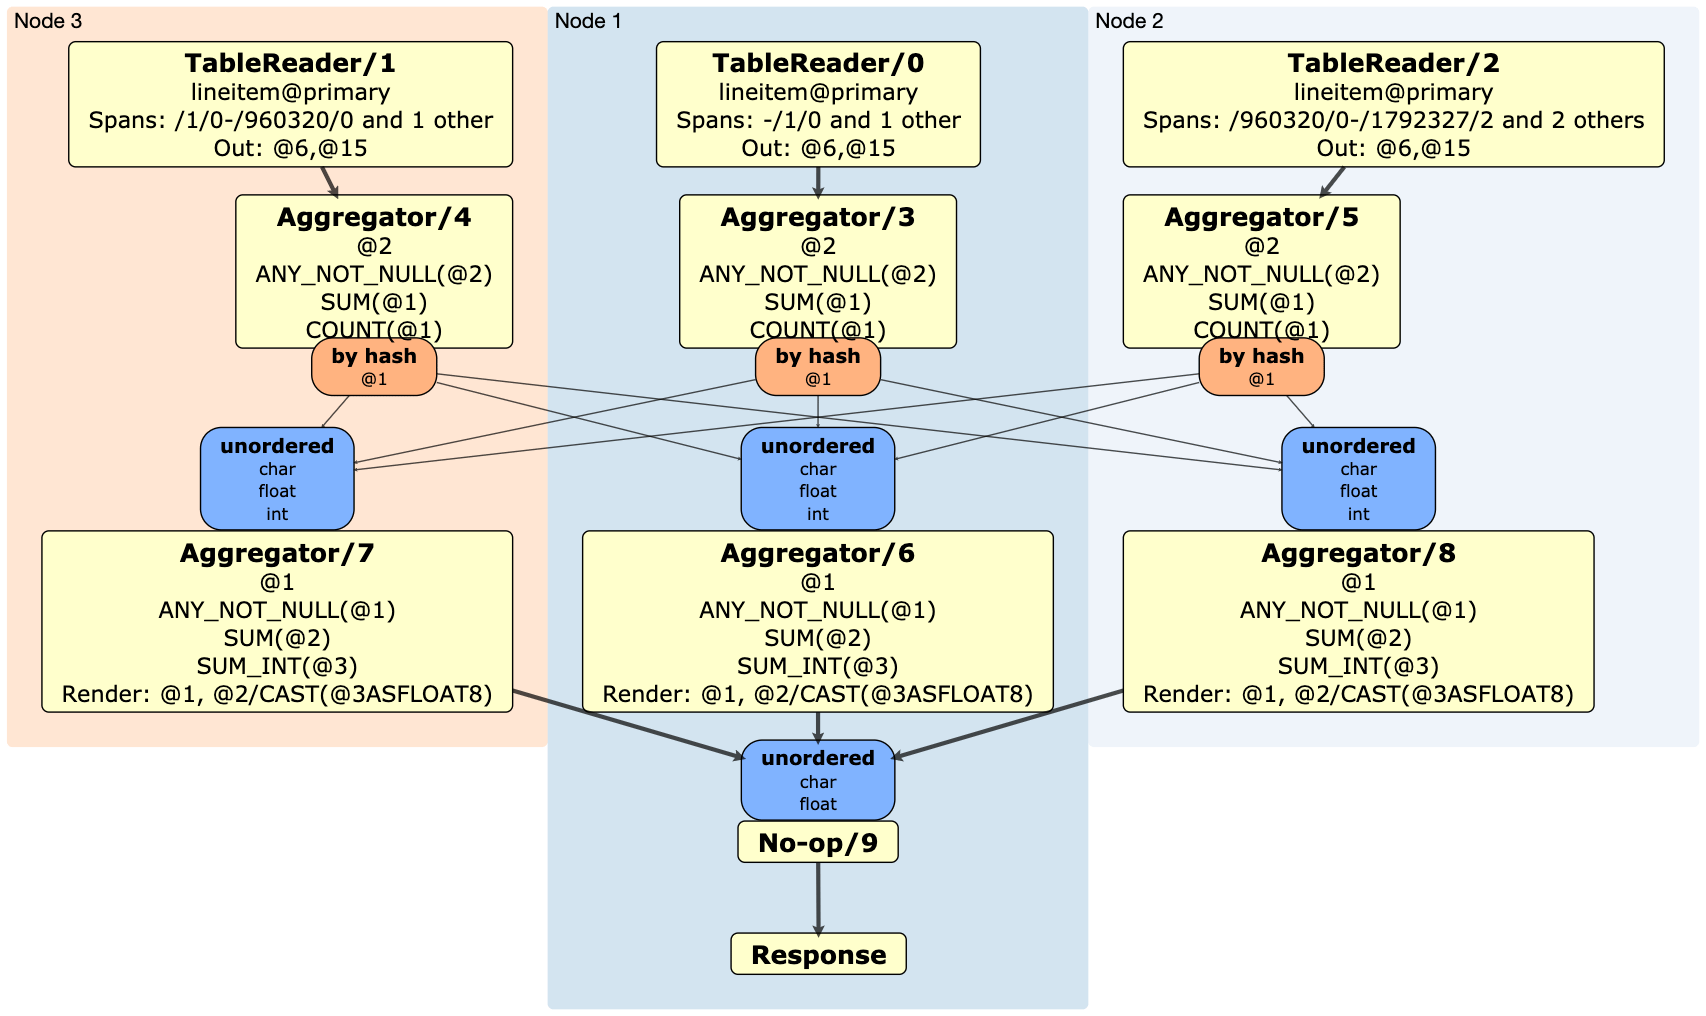
TYPES option
The TYPES option includes:
- The types of the values used in the statement plan.
- The SQL expressions that were involved in each processing stage, and the columns used by each level.
- All information that is included with the
VERBOSEoption.
REDACT option
The REDACT option causes constants, literal values, parameter values, and personally identifiable information (PII) to be redacted as ‹×› in the physical statement plan.
You can also use REDACT with the OPT option and its suboptions.
revenue comparison value is redacted as ‹×›.
OPT option
To display the statement plan tree generated by the , use the OPT option . For example:
OPT has five suboptions: VERBOSE, TYPES, ENV, MEMO, REDACT.
OPT, VERBOSE option
To include cost details used by the optimizer in planning the query, use the OPT, VERBOSE option:
OPT, TYPES option
To include cost and type details, use the OPT, TYPES option:
OPT, ENV option
To include all details used by the optimizer, including statistics, use the OPT, ENV option.
EXPLAIN (OPT, ENV) is a URL with the data encoded in the fragment portion. Encoding the data makes it easier to share debugging information across different systems without encountering formatting issues. Opening the URL shows a page with the decoded data. The data is processed in the local browser session and is never sent out over the network. Keep in mind that if you are using any browser extensions, they may be able to access the data locally.
OPT, MEMO option
The MEMO suboption prints a representation of the optimizer memo with the best plan. You can use the MEMO flag in combination with other flags. For example, EXPLAIN (OPT, MEMO, VERBOSE) prints the memo along with verbose output for the best plan.
OPT, REDACT option
The REDACT suboption causes constants, literal values, parameter values, and personally identifiable information (PII) to be redacted as ‹×› in the physical statement plan.
You can also use the REDACT option in combination with the VERBOSE, TYPES, and MEMO suboptions.
revenue comparison value is redacted as ‹×›.
VEC option
To view details about the for the query, use the VEC option.
DISTSQL option
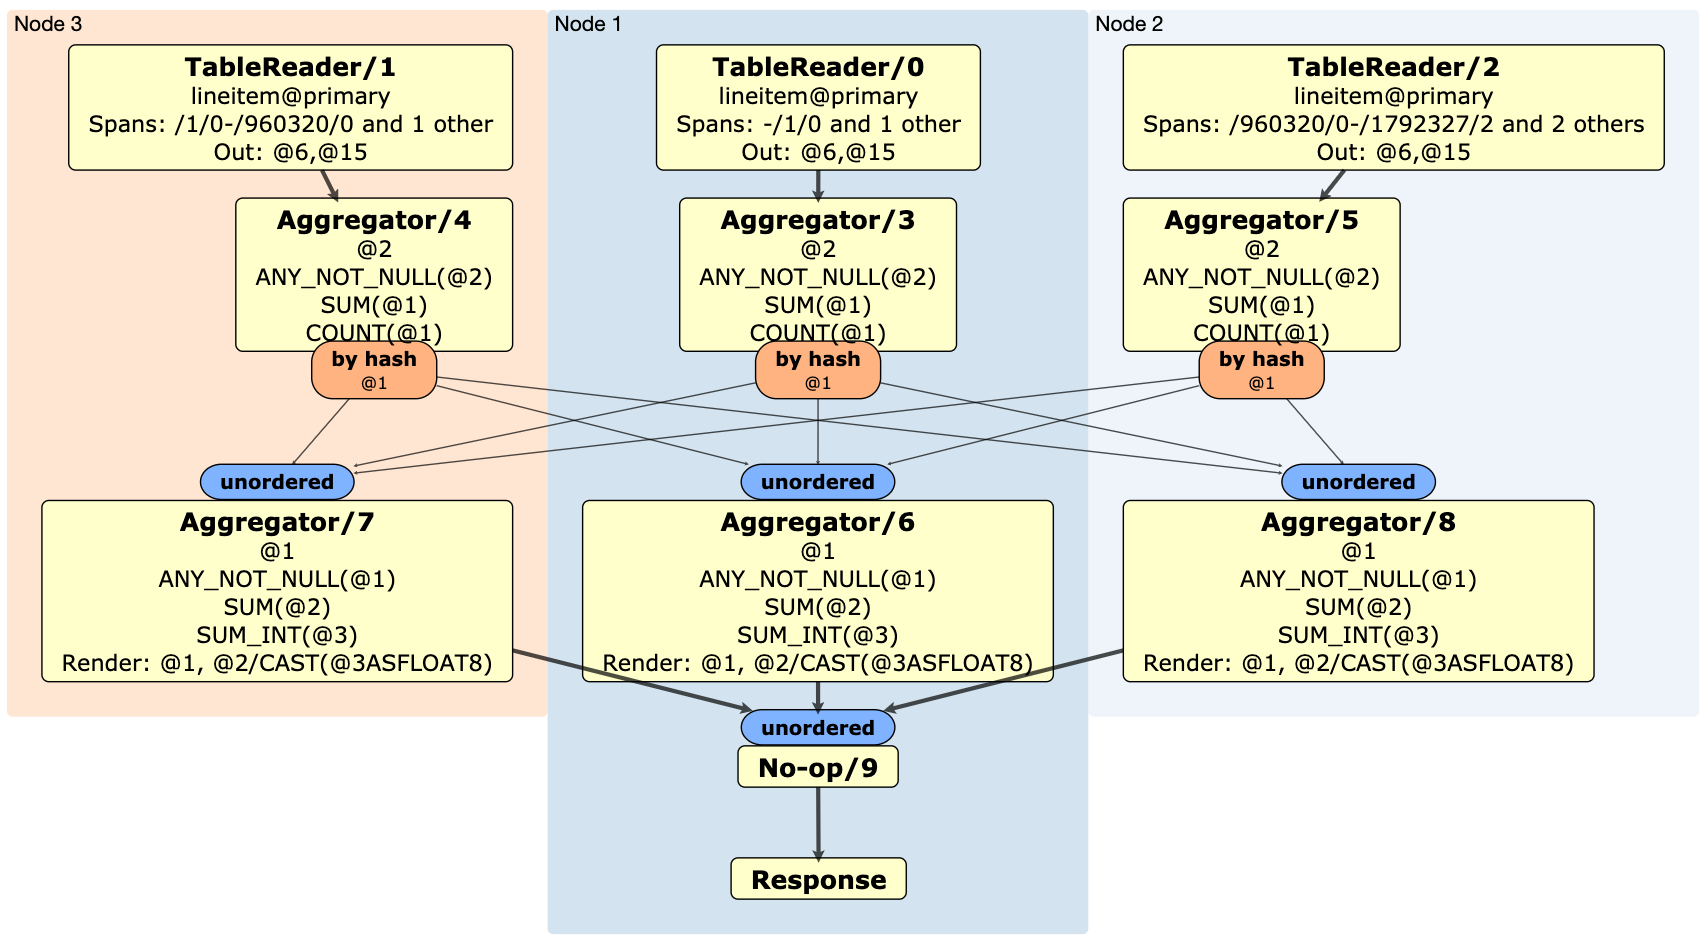
To view a physical statement plan that provides high level information about how a query will be executed, use the DISTSQL option. For more information about distributed SQL queries, see the .
The generated physical statement plan is encoded into a byte string after the fragment identifier (#) in the generated URL. The fragment is not sent to the web server; instead, the browser waits for the web server to return a decode.html resource, and then JavaScript on the web page decodes the fragment into a physical statement plan diagram. The statement plan is, therefore, not logged by a server external to the CockroachDB cluster and not exposed to the public internet.
For example, the following EXPLAIN (DISTSQL) statement generates a physical plan for a simple query against the TPC-H database loaded to a 3-node CockroachDB cluster:
EXPLAIN (DISTSQL) is a URL for a graphical diagram that displays the processors and operations that make up the physical statement plan. For details about the physical statement plan, see .
EXPLAIN(DISTSQL, TYPES):
Find the indexes and key ranges a query uses
You can useEXPLAIN to understand which indexes and key ranges queries use, which can help you ensure a query isn’t performing a full table scan.
v is not indexed, queries filtering on it alone scan the entire table:
disallow_full_table_scans .
When disallow_full_table_scans=on, attempting to execute a query with a plan that includes a full table scan will return an error:
v, CockroachDB would be able to avoid scanning the entire table:
v is getting scanned, specifically the key range starting at (and including) 4 and stopping before 6. This statement plan is not distributed across nodes on the cluster.
Find out if a statement is using SELECT FOR UPDATE locking
CockroachDB has support for ordering transactions by controlling concurrent access to one or more rows of a table using locks. SELECT FOR UPDATE locking can result in improved performance for contended operations. It applies to the following statements:
EXPLAIN to determine whether the following UPDATE is using SELECT FOR UPDATE locking.
locking strength field, which means that SELECT FOR UPDATE locking is being used. If the locking strength field does not appear, the statement is not using SELECT FOR UPDATE locking.
SELECT FOR UPDATE locking is enabled for the initial row scan of UPDATE and UPSERT statements. To disable it, toggle the .