

Dashboard navigation
Use the Graph menu to display metrics for your entire cluster or for a specific node. To the right of the Graph and Dashboard menus, a time interval selector allows you to filter the view for a predefined or custom time interval. Use the navigation buttons to move to the previous, next, or current time interval. When you select a time interval, the same interval is selected in the pages. However, if you select 10 or 30 minutes, the interval defaults to 1 hour in SQL Activity pages. When viewing graphs, a tooltip will appear at your mouse cursor providing further insight into the data under the mouse cursor. Click anywhere within the graph to pin the tooltip in place, decoupling the tooltip from your mouse movements. Click anywhere within the graph to cause the tooltip to follow your mouse once more. The Hardware dashboard displays the following time series graphs:CPU Percent
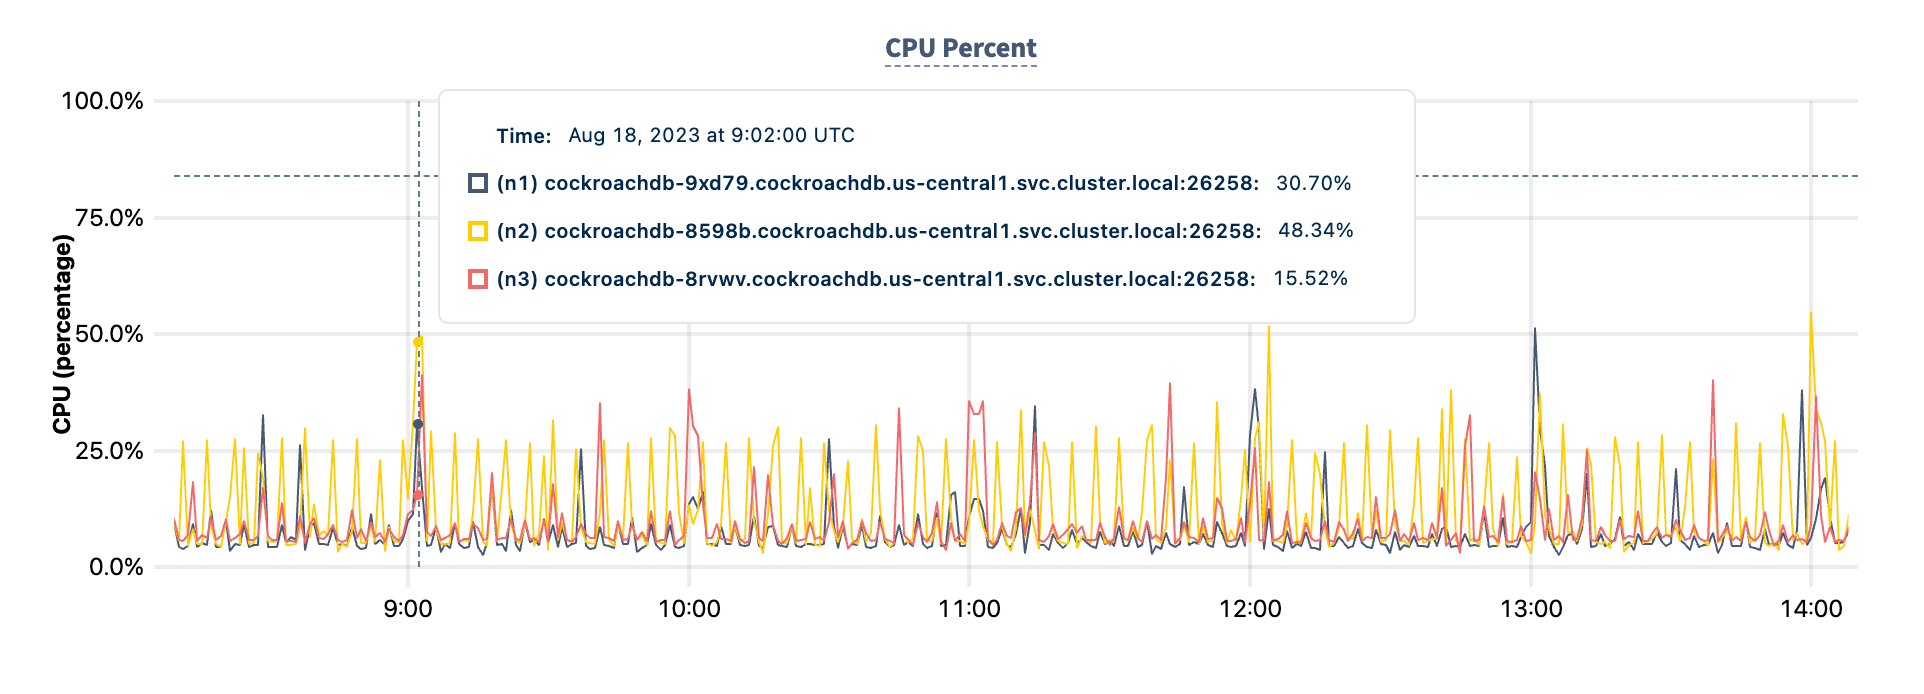
sys.cpu.combined.percent-normalized metric.
This graph shows the CPU consumption by the CockroachDB process, and excludes other processes on the node. Use the to measure the total CPU consumption across all processes.
- In the node view, the graph shows the percentage of CPU in use by the CockroachDB process for the selected node.
- In the cluster view, the graph shows the percentage of CPU in use by the CockroachDB process across all nodes.
For multi-core systems, the percentage of CPU usage is calculated by normalizing the CPU usage across all cores, whereby 100% utilization indicates that all cores are fully utilized.
Host CPU Percent
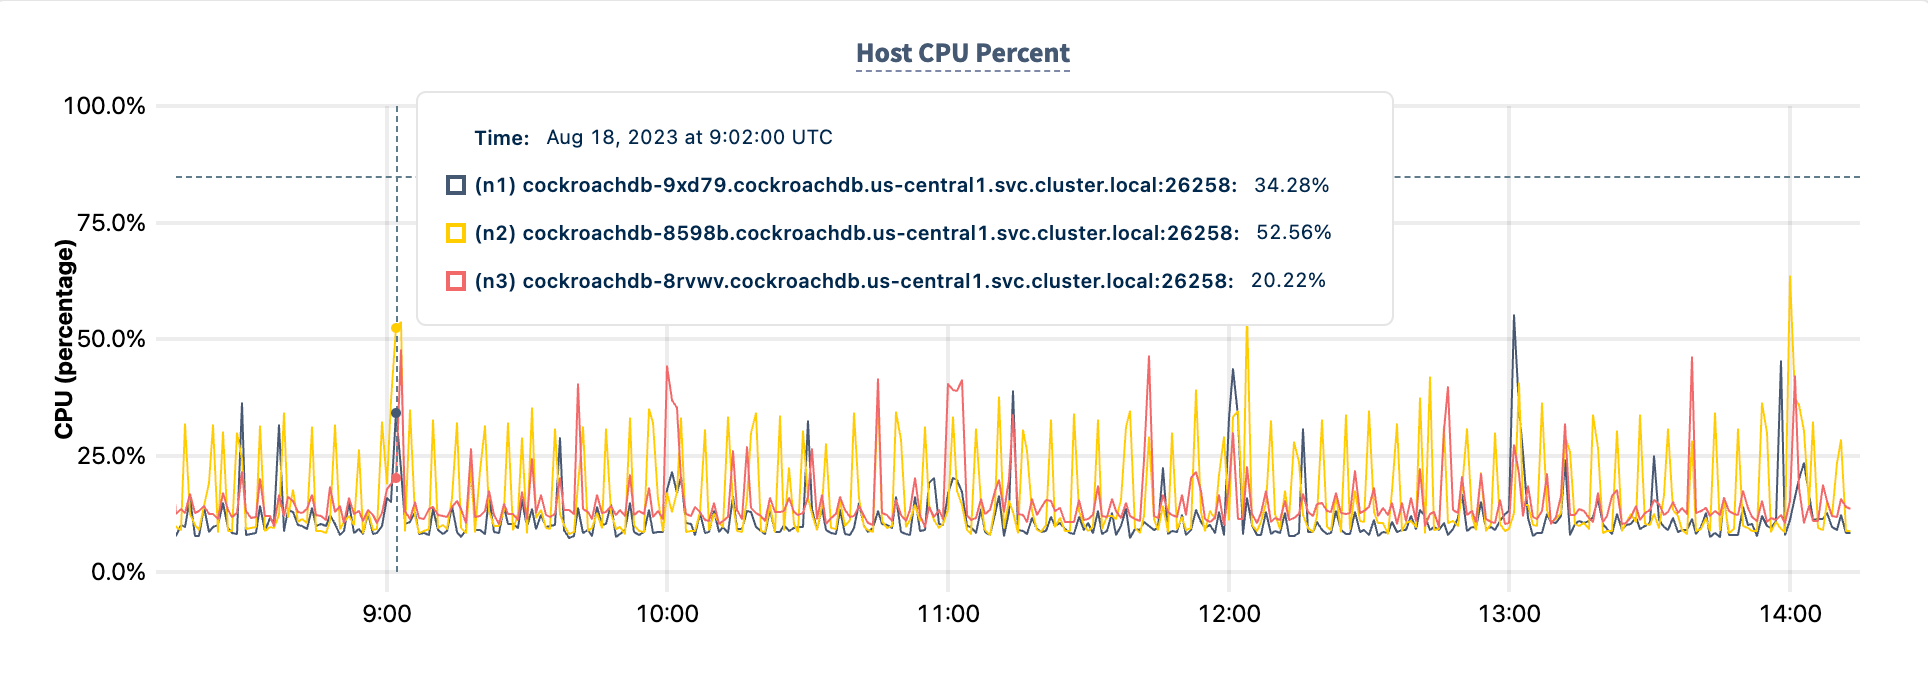
sys.cpu.host.combined.percent-normalized metric. If the CockroachDB process is run in a containerized environment, the host OS is the container since the CockroachDB process cannot inspect CPU usage beyond the container.
- In the node view, the graph shows the percentage of CPU in use by all processes for the selected node.
- In the cluster view, the graph shows the percentage of CPU in use by all processes across all nodes.
Memory Usage
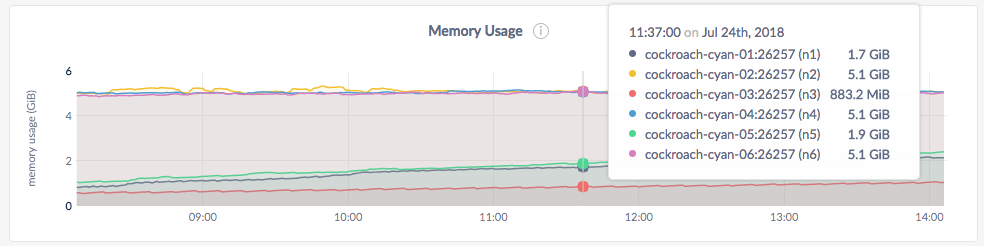
This graph shows the memory consumption by the CockroachDB process only and is useful as long as there are no other processes consuming significant memory on the node. In case you have other processes running on the node, use a separate monitoring tool to measure the total memory consumption across all processes.
- In the node view, the graph shows the memory in use by CockroachDB for the selected node.
- In the cluster view, the graph shows the memory in use by CockroachDB across all nodes in the cluster.
Disk Read Bytes
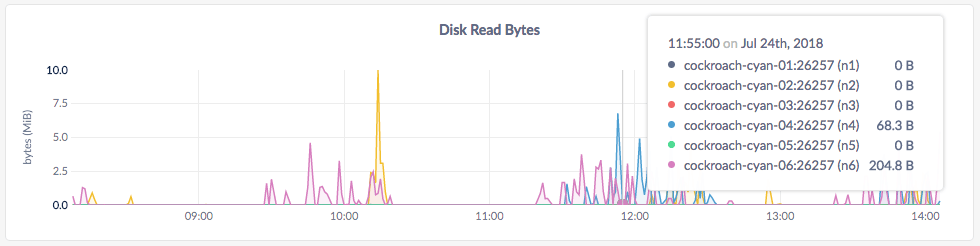
- In the node view, the graph shows the 10-second average of the number of bytes read per second by all processes, including CockroachDB, for the selected node.
- In the cluster view, the graph shows the 10-second average of the number of bytes read per second by all processes, including CockroachDB, across all nodes.
Disk Write Bytes
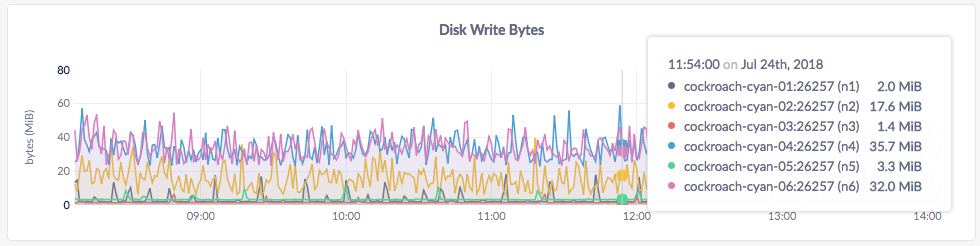
- In the node view, the graph shows the 10-second average of the number of bytes written per second by all processes, including CockroachDB, for the node.
- In the cluster view, the graph shows the 10-second average of the number of bytes written per second by all processes, including CockroachDB, across all nodes.
Disk Read Ops
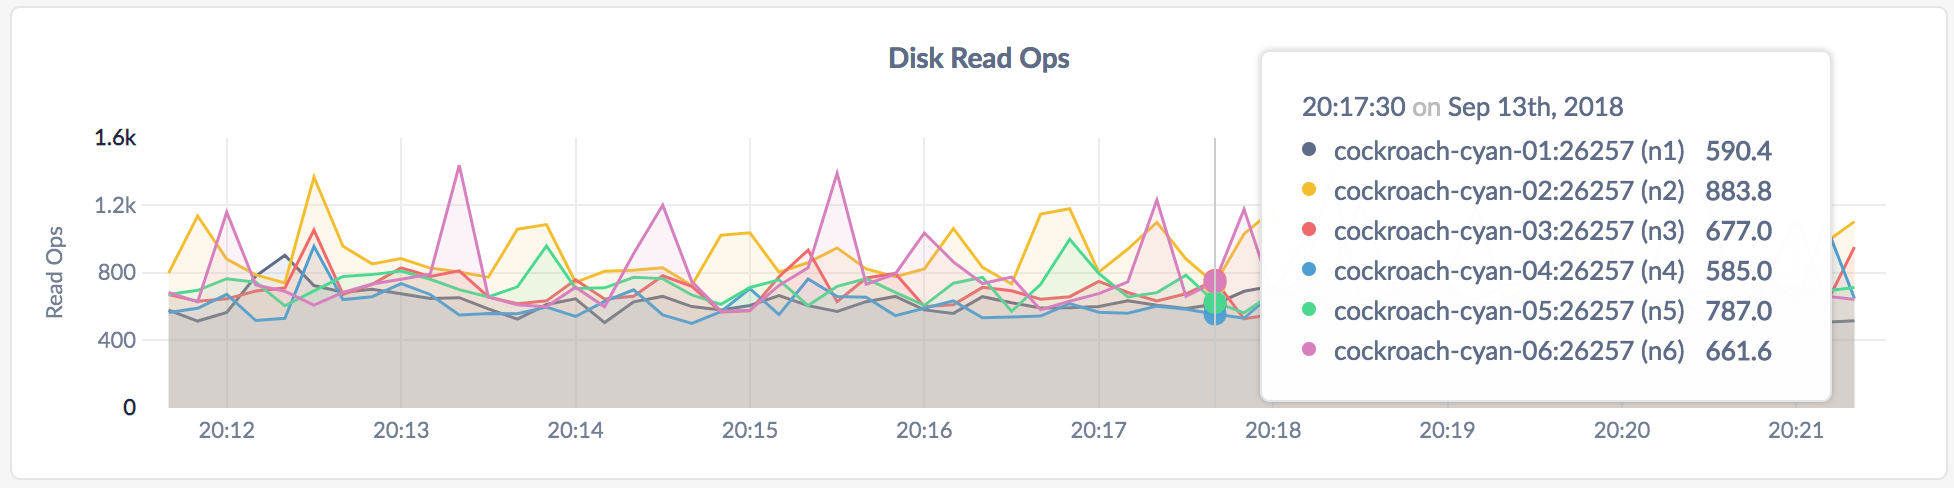
- In the node view, the graph shows the 10-second average of the number of disk read ops per second for all processes, including CockroachDB, for the selected node.
- In the cluster view, the graph shows the 10-second average of the number of disk read ops per second for all processes, including CockroachDB, across all nodes.
Disk Write Ops
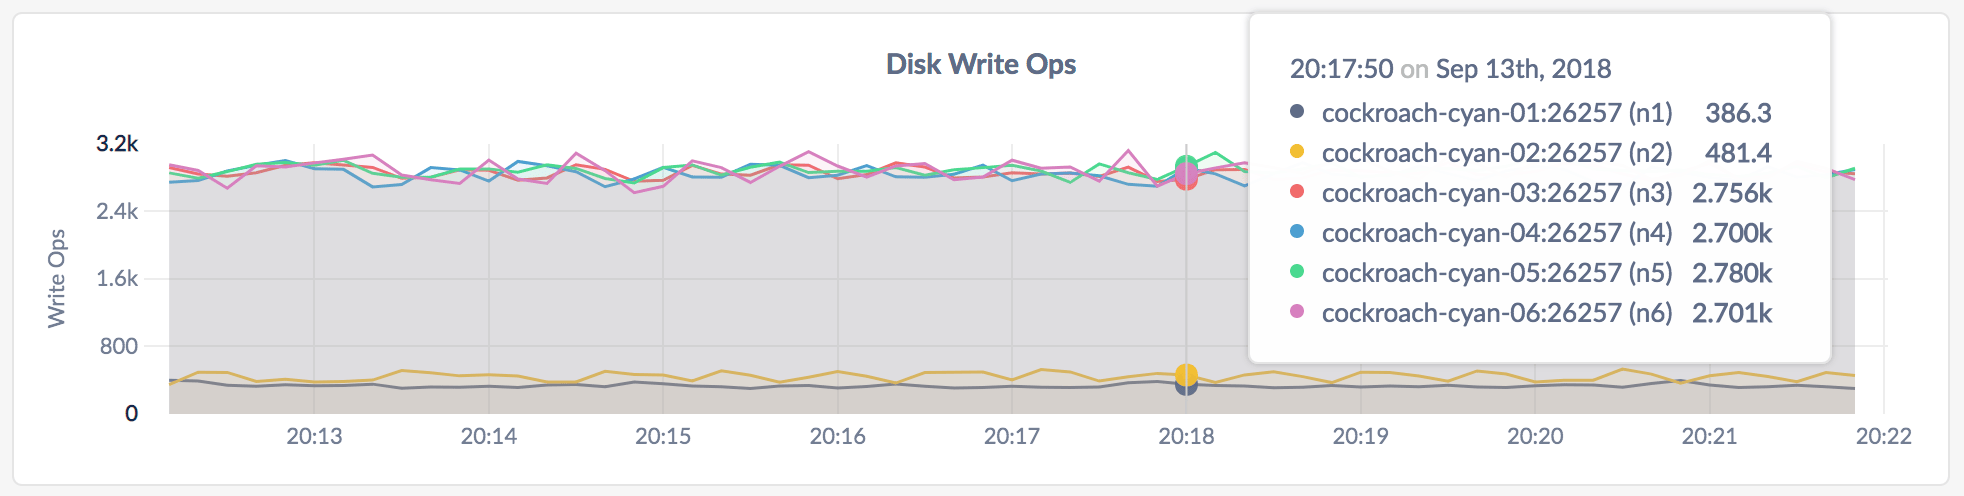
- In the node view, the graph shows the 10-second average of the number of disk write ops per second for all processes, including CockroachDB, for the node.
- In the cluster view, the graph shows the 10-second average of the number of disk write ops per second for all processes, including CockroachDB, across all nodes.
Disk Ops In Progress
- In the node view, the graph shows the number of disk reads and writes in queue for all processes, including CockroachDB, for the selected node.
- In the cluster view, the graph shows the number of disk reads and writes in queue for all processes, including CockroachDB, across all nodes in the cluster.
On macOS, this graph is currently not populated and shows zero disk ops in progress.
Available Disk Capacity
Capacity metrics
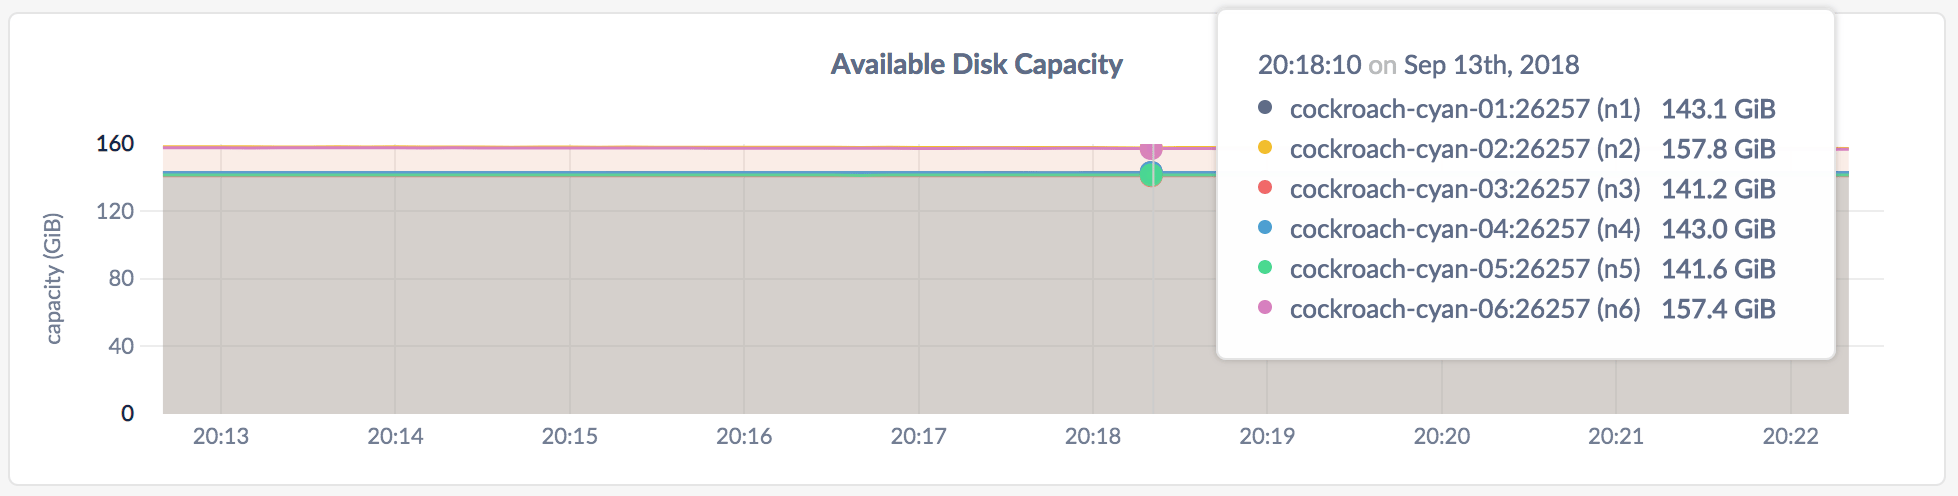
The available disk capacity equals the amount of empty disk space, up to the value of the maximum store size. The store size is determined as follows:- If a store size was specified using the flag when starting nodes, this value is used as the limit for CockroachDB data.
- If no store size has been explicitly set, the actual disk capacity is used as the limit for CockroachDB data.
Network Bytes Received
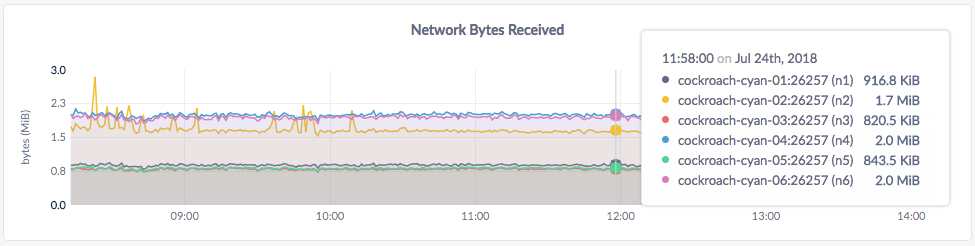
- In the node view, the graph shows the 10-second average of the number of network bytes received per second for all processes, including CockroachDB, for the node.
- In the cluster view, the graph shows the 10-second average of the number of network bytes received for all processes, including CockroachDB, per second across all nodes.
Network Bytes Sent
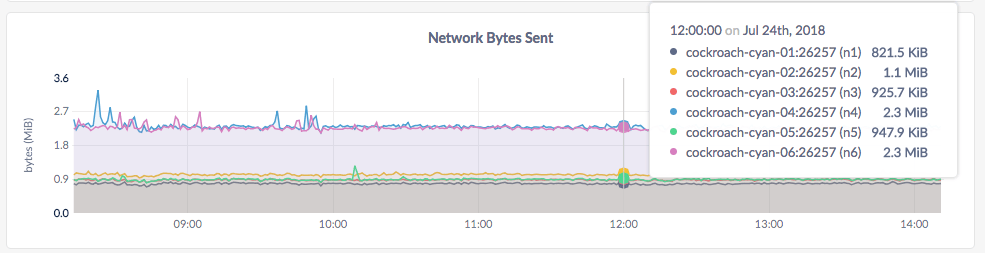
- In the node view, the graph shows the 10-second average of the number of network bytes sent per second by all processes, including CockroachDB, for the node.
- In the cluster view, the graph shows the 10-second average of the number of network bytes sent per second by all processes, including CockroachDB, across all nodes.