
CockroachDB enables you to programmatically create and tag your SQL connections with a custom name or label. This practice lets you to quickly identify which part of your application is potentially degraded due to database health and design. By identifying problematic transactions and statements, you can quickly trace back to parts of your applications that generated those transactions and statements for a holistic understanding of the application performance impact as well as potential mitigation and . This page shows how to set and filter database workloads by application name.

Set the application name

It is best practice to set the application name with CockroachDB. You can do this in the postgres://root@<servername:26257/mydb?application_name=movr_app or at the :

Filter database workloads by application name

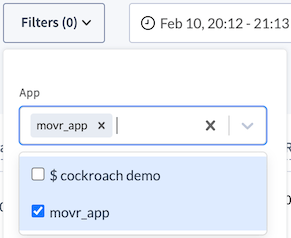
Once you set the application name, the lets you . Movr app filter If parts of your applications or known microservices are experiencing performance degradation, you can filter for the database workload tracing statements and transactions back to that part of your application directly in the DB Console. You can quickly identify whether there were database performance problems and if so, troubleshoot the issue using SQL observability touch points in the DB Console. You can also programmatically filter crdb_internal tables and by application name. This example shows the first 60 characters of query text and statement statistics for queries associated with the movr_app application:
Trace SQL activity using metrics

Often signals to problems start at high-level metrics. The has metrics for , , , etc., that can quickly signify potential issues with your application. The statement and transaction statistics described in the preceding section enable you to correlate high-level metrics with lower level SQL activity information where you can identify the specific statements and transactions that were running during that time.

See also