

Sort and filter network latencies
Use the Sort By menu to arrange the network matrix by (e.g., cloud, region, availability zone, datacenter). Use the Filter menu to select specific nodes or localities to view. Select Collapse Nodes to display the mean latencies of each locality, depending on how the matrix is sorted. This is a way to quickly assess cross-regional or cross-cloud latency.Interpret the network matrix
Each cell in the matrix displays the round-trip latency in milliseconds between two nodes in your cluster. Round-trip latency includes the return time of a packet. Latencies are color-coded by their standard deviation from the mean latency on the network: green for lower values, and blue for higher. Nodes with the lowest latency are displayed in darker green, and nodes with the highest latency are displayed in darker blue.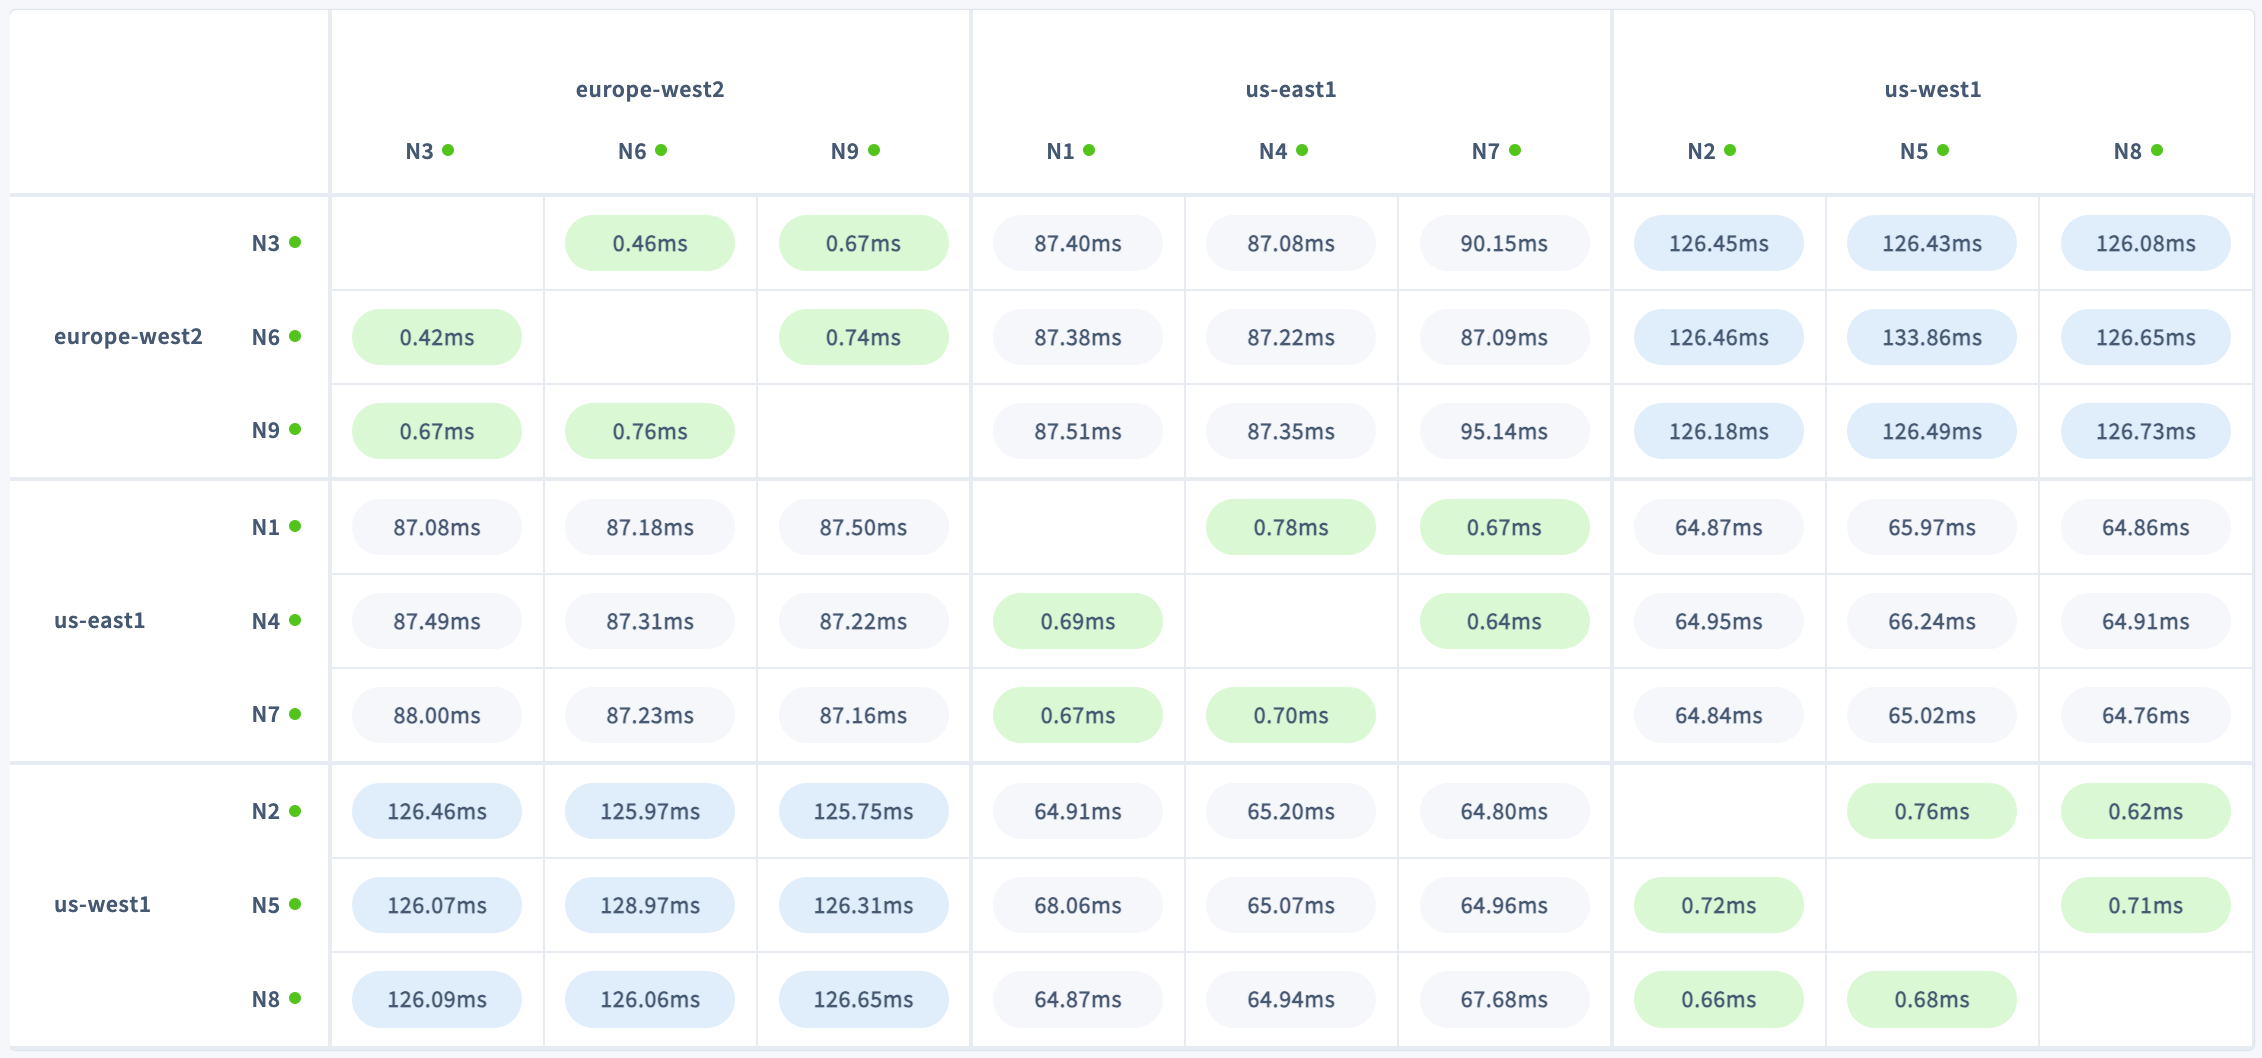
- The direction of the connection marked by
FromandTo. - Locality metadata for origin and destination.q
- Round-trip latency.
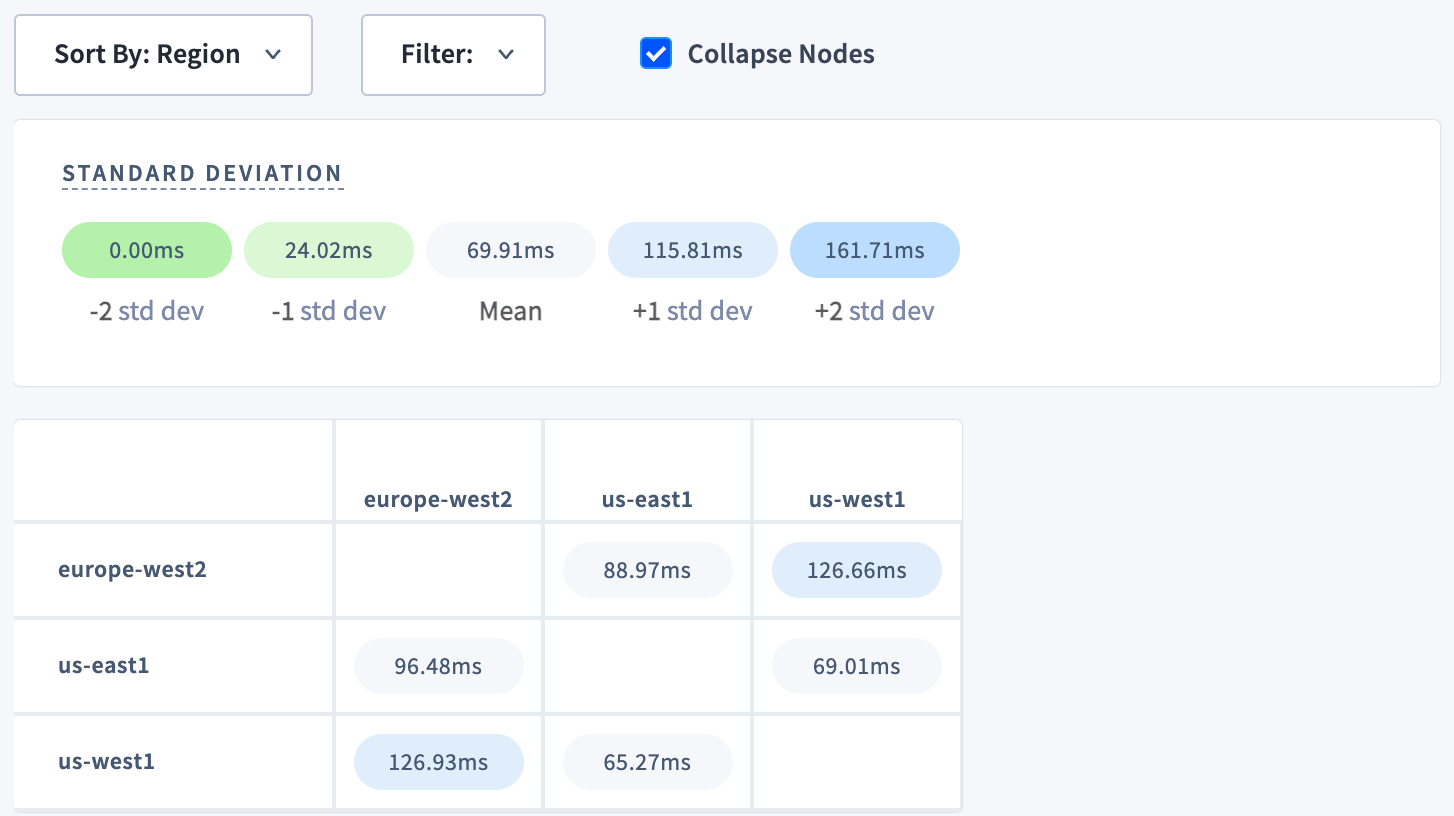
us-west1, us-east1, and europe-west2. Latencies are highest between nodes in us-west1 and europe-west2, which span the greatest distance. This is especially clear when sorting by region or availability zone and collapsing nodes:
No connections
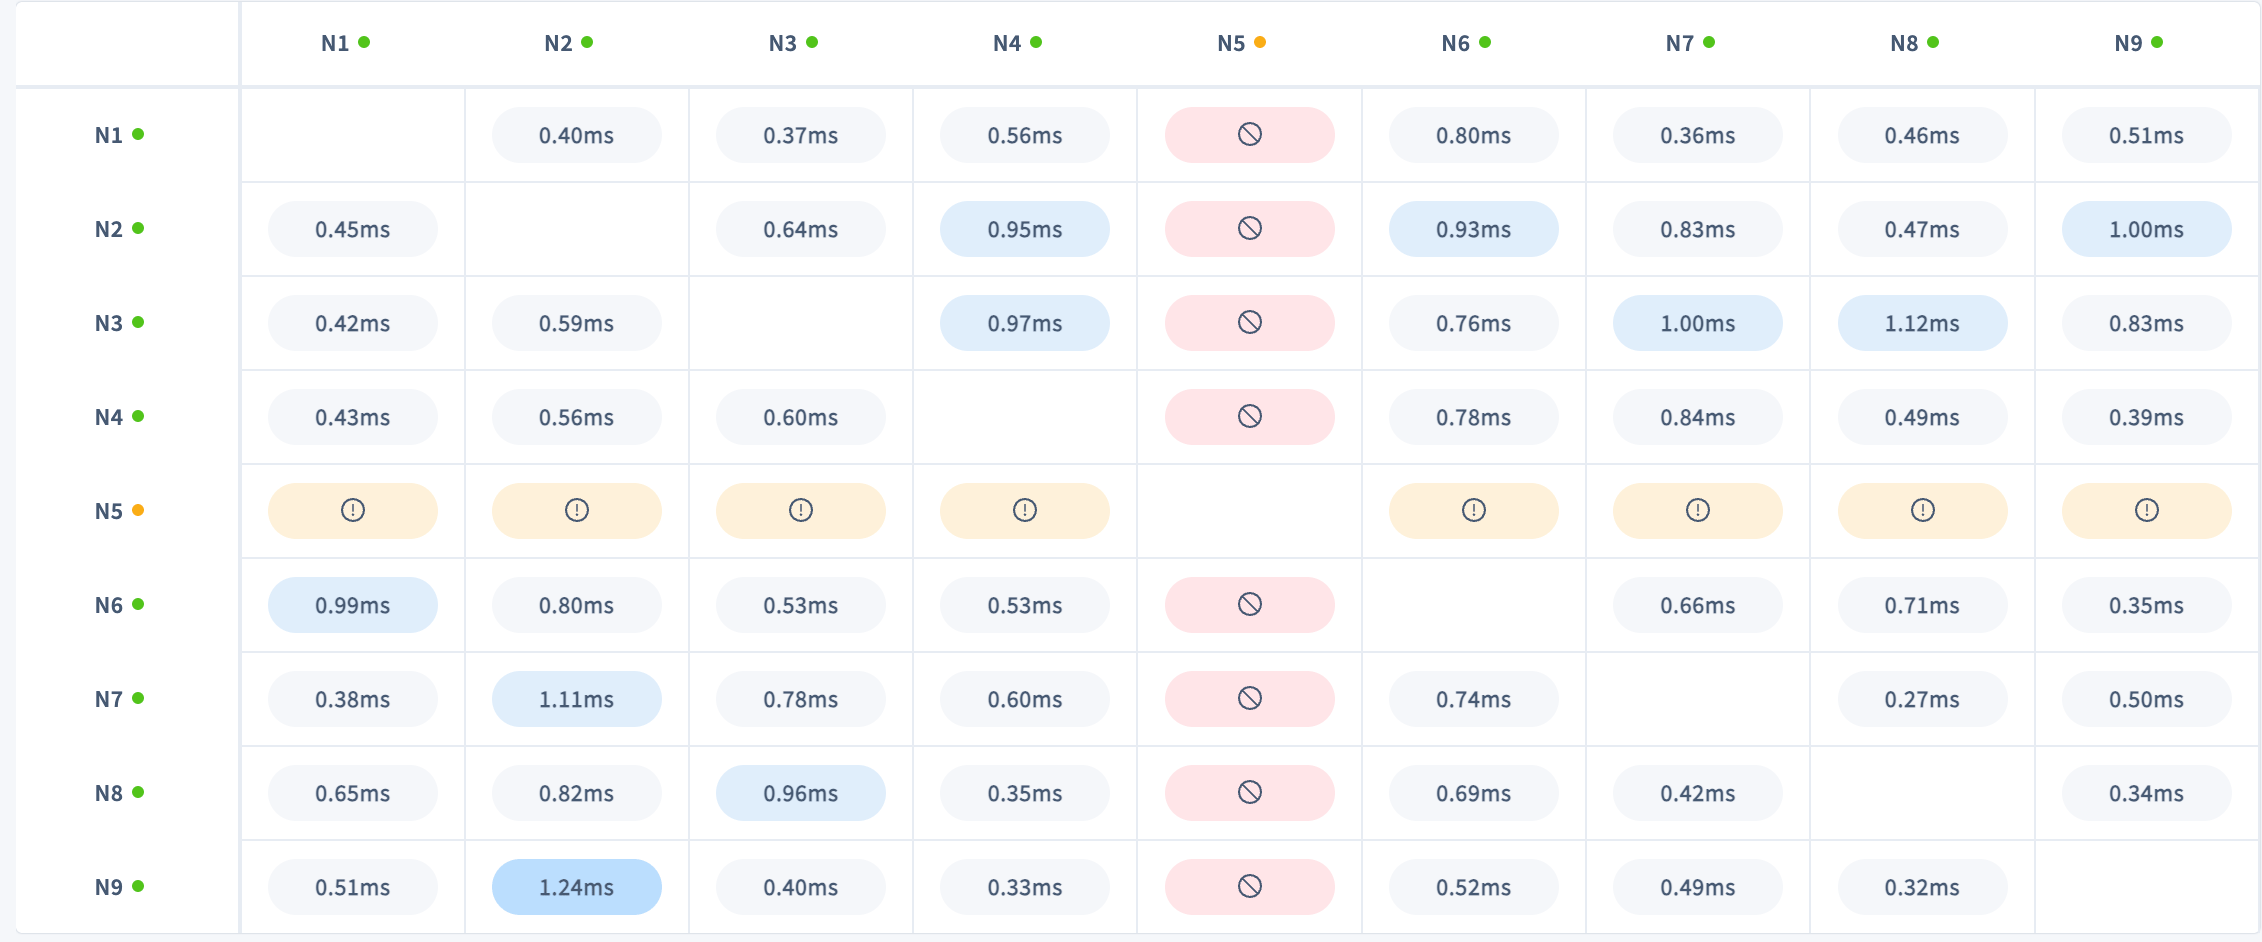
Nodes that have completely lost connectivity are color-coded depending on connection status:- Orange with an exclamation mark indicates
unknown connection state. - Red with a no symbol indicates
Failed connection.
- The direction of the connection marked by
FromandTo. - Locality metadata for origin and destination.
- Connection status.
- The error message that resulted from the most recent connection attempt.
(n-1)/2 replicas from a will cause range unavailability which will cause some data unavailability. If there are no localities or other constraints on where replicas are placed, then a partition of any ( / 2) nodes will likely cause unavailability.
With the introduction of , most network partitions between a leaseholder and its followers should heal in a few seconds.
Node liveness status
Hover over a node’s ID in the row and column headers to show the node’s status, such ashealthy or suspect. Node liveness status is also indicated by the colored circle next to the Node ID: green for healthy or red for suspect.
If a suspect node stays offline for the duration set by (5 minutes by default), the and the node is removed from the matrix.
The number of LIVE (healthy), SUSPECT, DRAINING and DEAD nodes is displayed under Node Status on the .
Topology fundamentals
- Multi-region topology patterns are almost always table-specific. If you haven’t already, to ensure you choose the right one for each of your tables.
- Review how data is replicated and distributed across a cluster, and how this affects performance. It is especially important to understand the concept of the “leaseholder”. For a summary, see . For a deeper dive, see the CockroachDB .
- Review the concept of , which CockroachDB uses to place and balance data based on how you define .
- Review the recommendations and requirements in our .
- This topology doesn’t account for hardware specifications, so be sure to follow our and perform a POC to size hardware for your use case. For optimal cluster performance, Cockroach Labs recommends that all nodes use the same hardware and operating system.
- Adopt relevant to ensure optimal performance.
Network latency limits the performance of individual operations. You can use the page to see the latencies of SQL statements on gateway nodes.