

Problems
This section describes how to use CockroachDB commands and dashboards to identify performance problems in your applications.| Observation | Diagnosis | Solution |
|---|---|---|
|
|
|
|
| |
|
| |
|
| |
|
| |
|
| |
|
| |
|
|
|
Solutions
This section provides solutions for common performance issues in your applications.Transaction contention
is a state of conflict that occurs when:- A is unable to complete due to another concurrent or recent transaction attempting to write to the same data. This is also called lock contention.
- A transaction is because it could not be placed into a among all of the currently-executing transactions. If the automatic retry is not possible or fails, a is emitted to the client, requiring a client application running under isolation to . This is also called a serialization conflict, or an isolation conflict.
Indicators that your application is experiencing transaction contention
Waiting transaction
These are indicators that a transaction is trying to access a row that has been by another, concurrent transaction issuing a or .- The Active Executions table on the Transactions page ( or ) shows transactions with
Waitingin the Status column. You can sort the table by Time Spent Waiting. - Querying the table shows transactions where is
false.
-
Querying the table
WHERE contention_type='LOCK_WAIT'indicates that your transactions have experienced lock contention.- This is also shown in the Transaction Executions view on the Insights page ( and ). Transaction executions will display the .
-
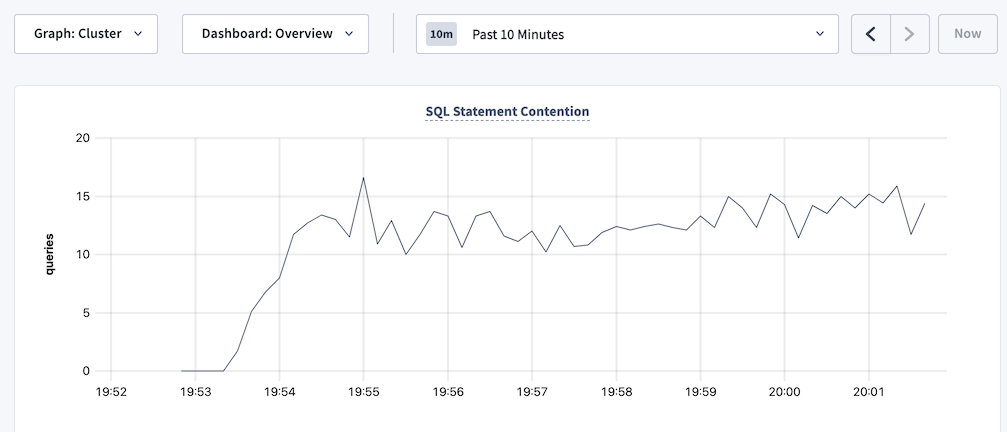
The SQL Statement Contention graph ( and ) is showing spikes over time.
- Identify the blocking transaction.
- Evaluate whether you can cancel the transaction. If so, cancel it to unblock the waiting transaction.
- Optimize the transaction to reduce further contention. In particular, break down larger transactions such as into smaller ones to have transactions hold locks for a shorter duration, and use when possible to reduce conflicts with other writes.
Transaction retry error
These are indicators that a transaction has failed due to .- A with
SQLSTATE: 40001, the string , and an error code such as or , is emitted to the client. These errors are typically seen under and not isolation. - Querying the table
WHERE contention_type='SERIALIZATION_CONFLICT'indicates that your transactions have experienced serialization conflicts.- This is also shown in the Transaction Executions view on the Insights page ( and ). Transaction executions will display the .
- The Transaction Restarts graph ( and ) is showing spikes in transaction retries over time.
-
Under
SERIALIZABLEisolation, update your application to support when transaction retry errors are encountered. Follow the guidance for the . - Take steps to in the first place. This means reducing transaction contention overall, and increasing the likelihood that CockroachDB can a failed transaction.
Fix transaction contention problems
Identify the transactions that are in conflict, and unblock them if possible. In general, take steps to reduce transaction contention. When running underSERIALIZABLE isolation, implement so that your application can respond to that are emitted when CockroachDB cannot a transaction.
Identify conflicting transactions
- In the Active Executions table on the Transactions page ( or ), look for a waiting transaction (
Waitingstatus).
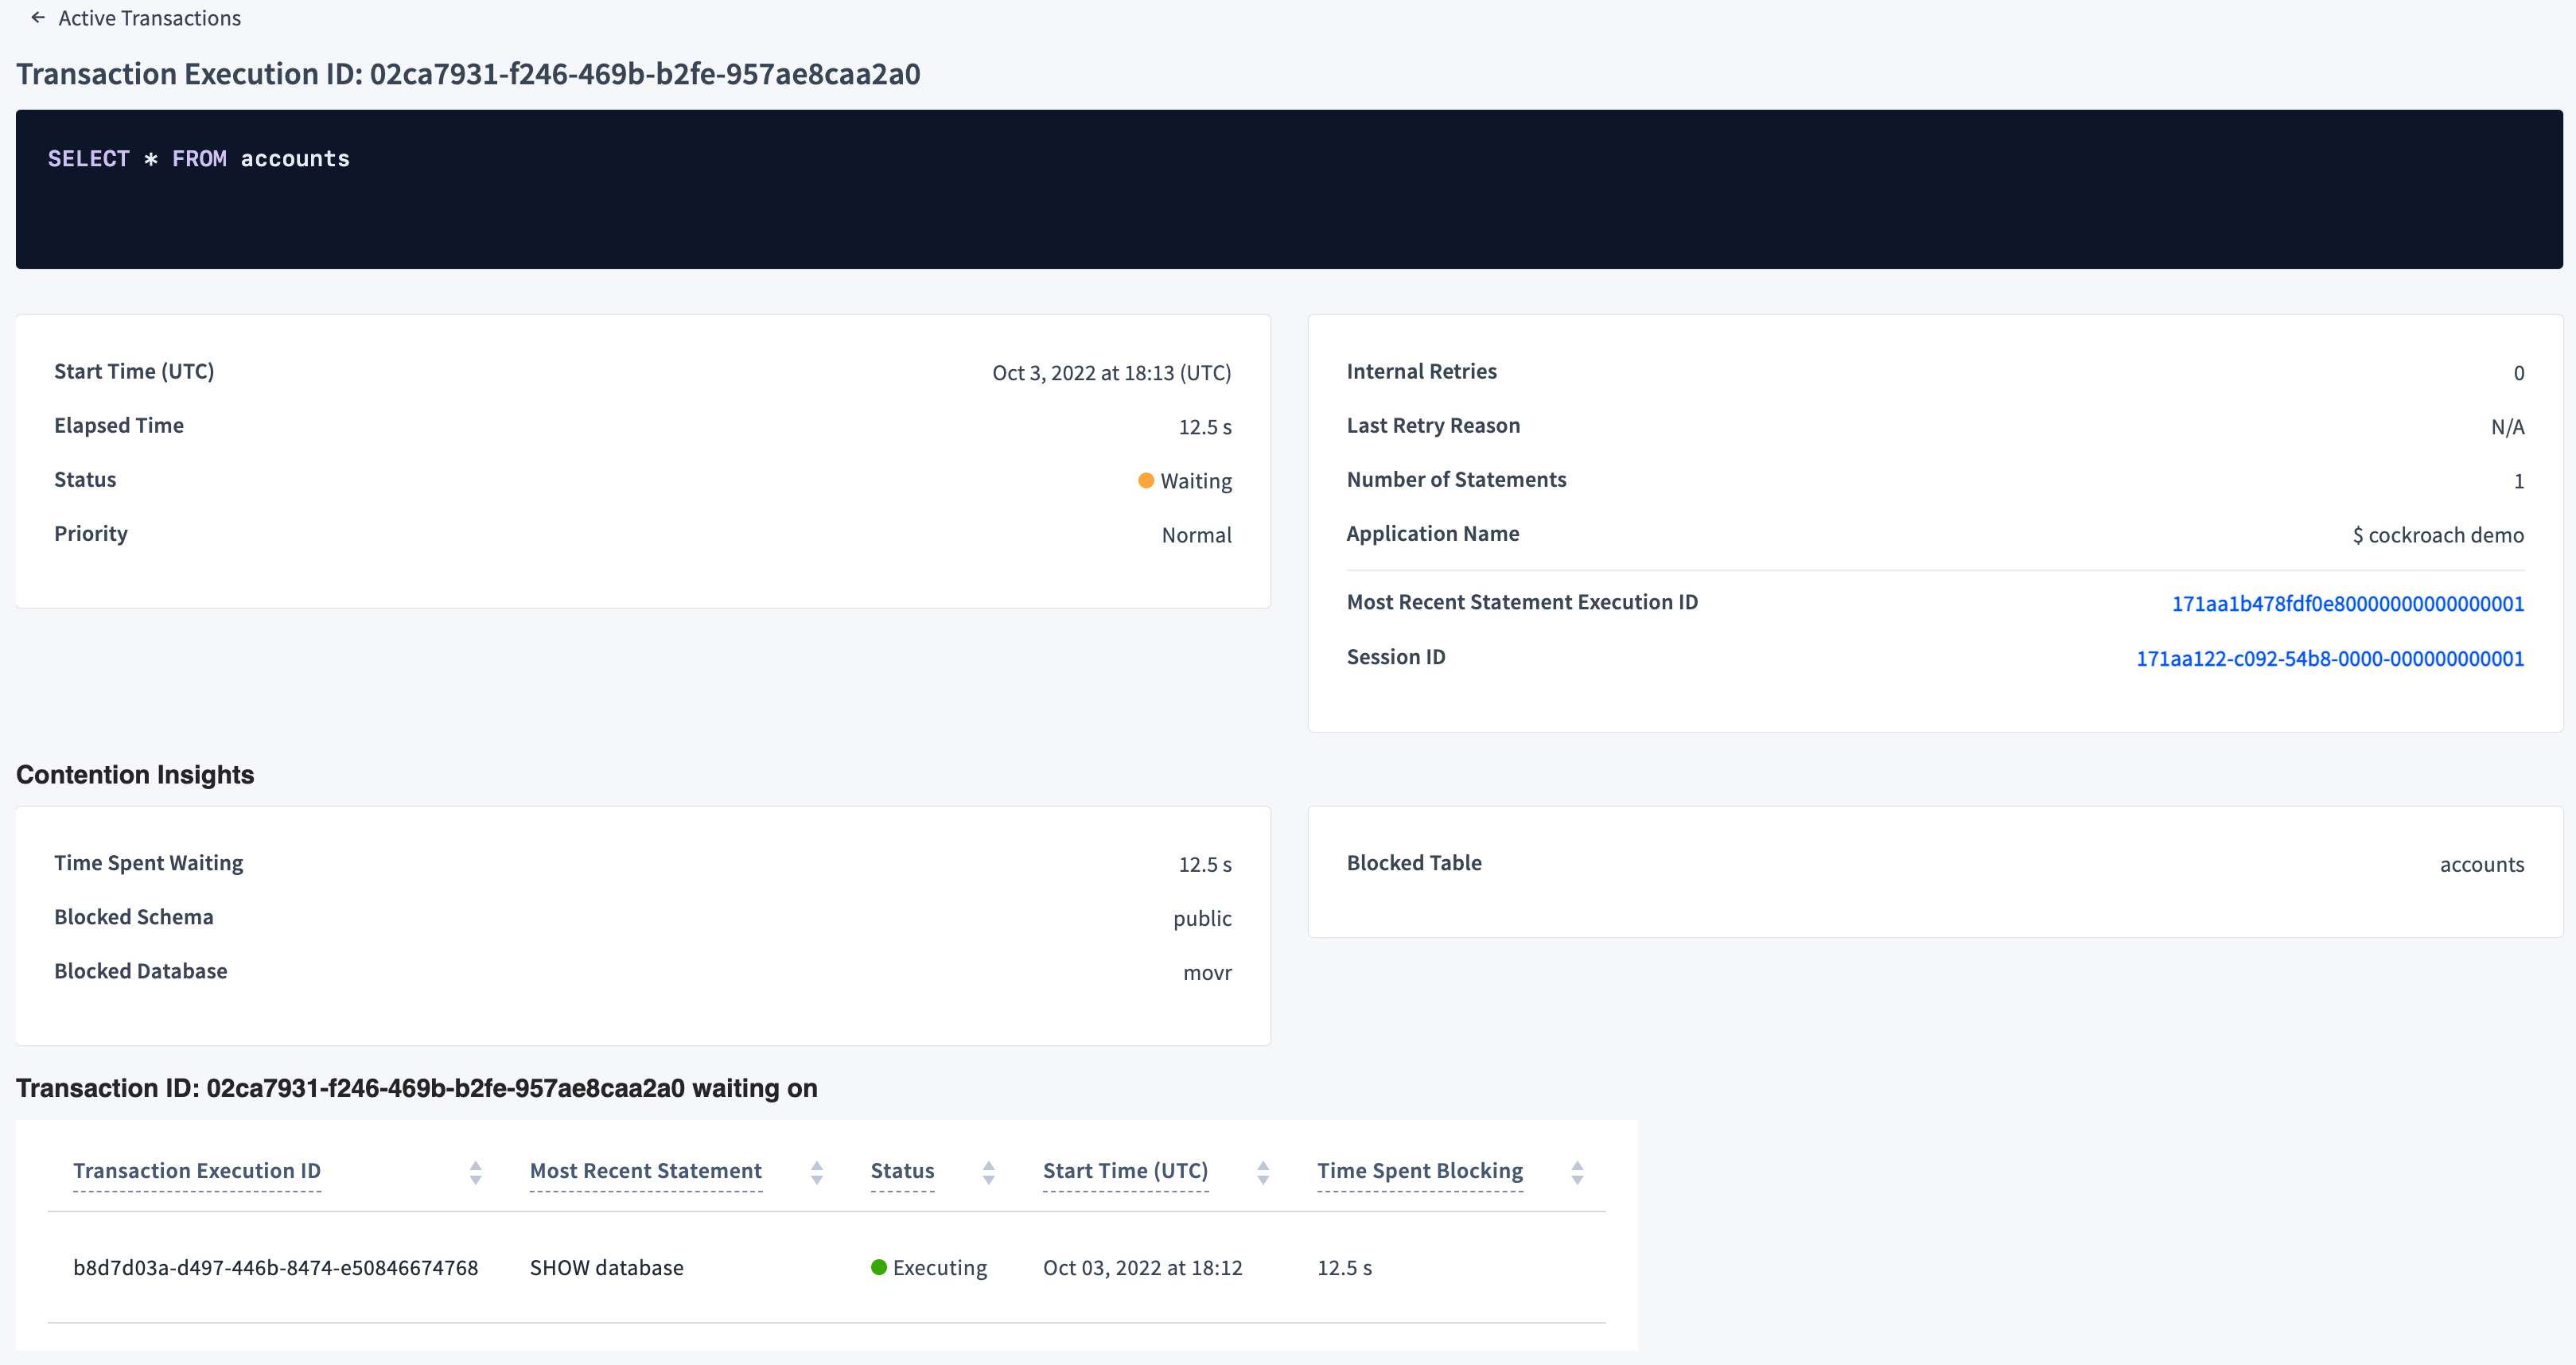
- Last Retry Reason shows the last transaction retry error received for the transaction, if applicable.
- The details of the blocking transaction, directly below the Contention Insights section. Click the blocking transaction to view its details.
Cancel a blocking transaction
- Identify the blocking transaction and view its transaction execution details.
- Click its Session ID to open the Session Details page.
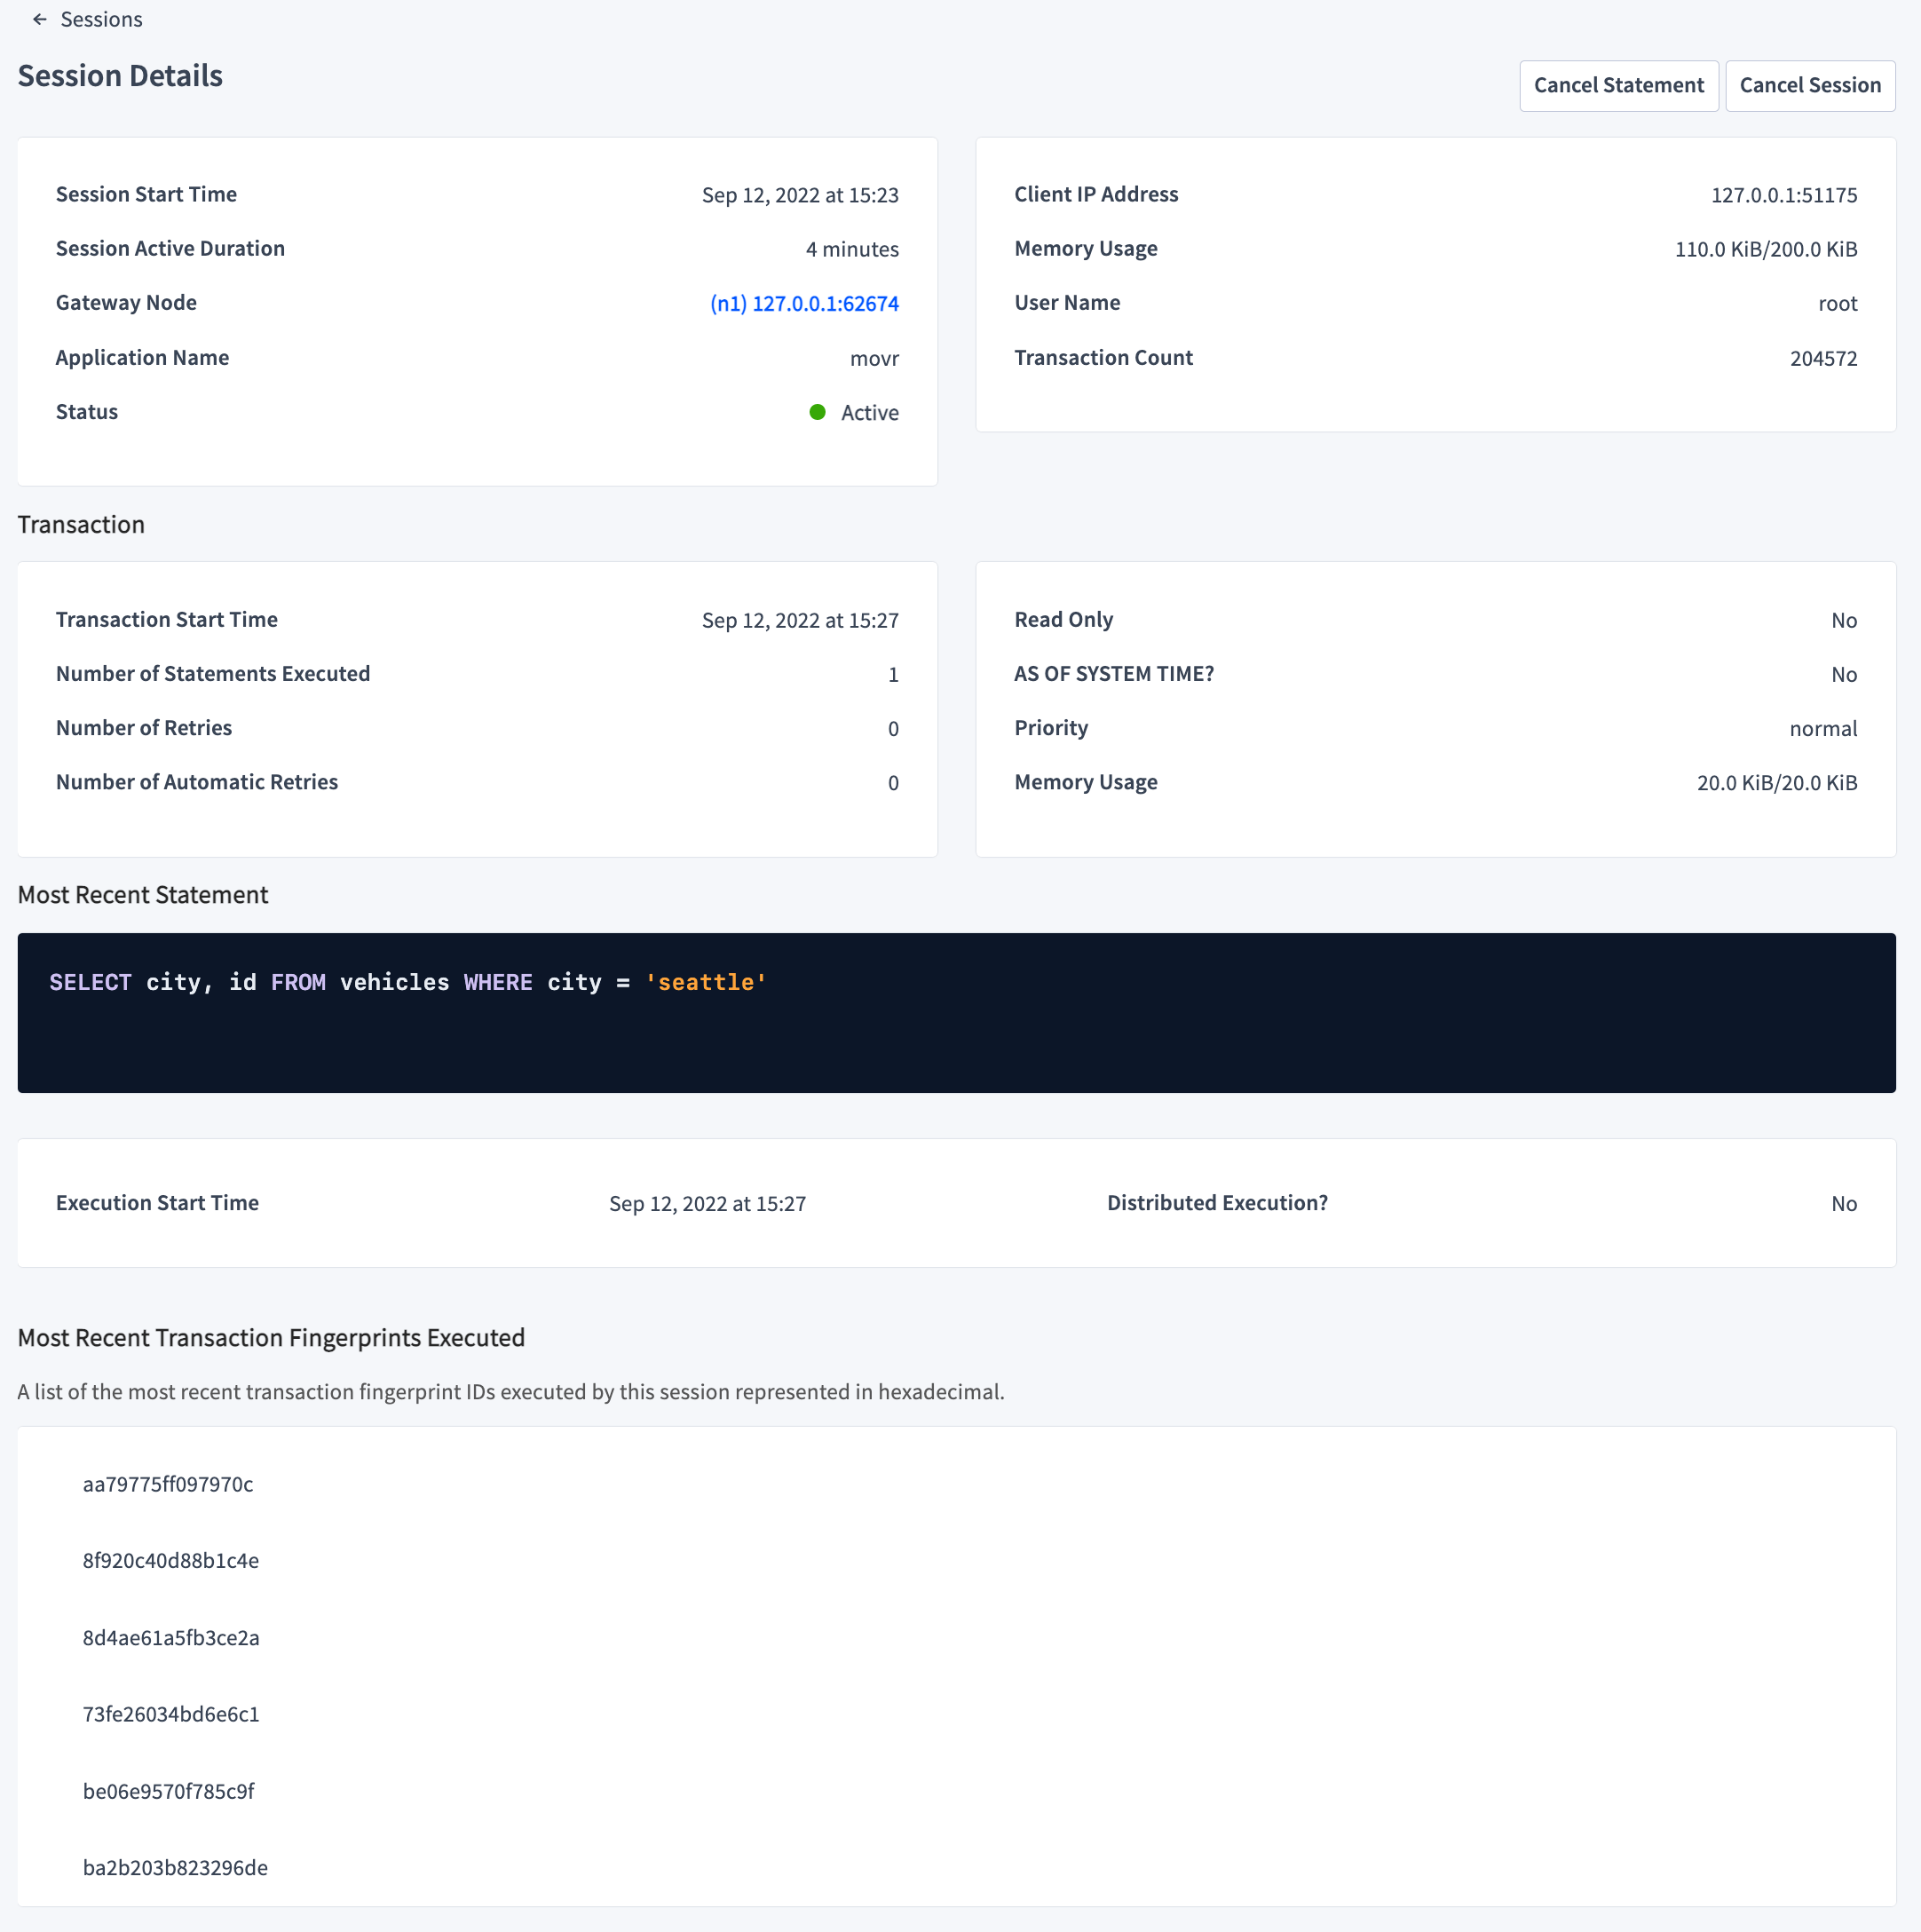
- Click Cancel Statement to cancel the Most Recent Statement and thus the transaction, or click Cancel Session to cancel the session issuing the transaction.
Identify transactions and objects that experienced lock contention
To identify transactions that experienced in the past:- In the Transaction Executions view on the Insights page ( and ), look for a transaction with the High Contention insight. Click the transaction’s execution ID and view the transaction execution details, including the details of the blocking transaction.
- Visit the Transactions page ( and ) and sort transactions by Contention Time.
- Query the table to view .
- Query the table to .
- Query the table to .
- Query the table to .
Reduce transaction contention
is often reported after it has already resolved. Therefore, preventing contention before it affects your cluster’s performance is a more effective approach:- Limit the number of affected rows by following (e.g., avoiding full scans, creating secondary indexes, etc.). Not only will transactions run faster, lock fewer rows, and hold locks for a shorter duration, but the chances of when the transaction’s , due to a conflicting write, are decreased because of a smaller read set (i.e., a smaller number of rows read).
- Break down larger transactions (e.g., ) into smaller ones to have transactions hold locks for a shorter duration. For example, use to group multiple clauses together in a single SQL statement. This will also decrease the likelihood of . For instance, as the size of writes (number of rows written) decreases, the chances of the transaction’s timestamp getting bumped by concurrent reads decreases.
-
Use to aggressively lock rows that will later be updated in the transaction. Updates must operate on the most recent version of a row, so a concurrent write to the row will cause a retry error (). Locking early in the transaction forces concurrent writers to block until the transaction is finished, which prevents the retry error. Note that this locks the rows for the duration of the transaction; whether this is tenable will depend on your workload. For more information, see When and why to use
SELECT FOR UPDATEin CockroachDB. -
Use historical reads (), preferably or when possible to reduce conflicts with other writes. This reduces the likelihood of errors as fewer writes will happen at the historical timestamp. More specifically, writes’ timestamps are less likely to be pushed by historical reads as they would . Note that if the
AS OF SYSTEM TIMEvalue is below the closed timestamp, the read cannot be invalidated. - When replacing values in a row, use and specify values for all columns in the inserted rows. This will usually have the best performance under contention, compared to combinations of , , and .
- If applicable to your workload, assign and separate columns that are frequently read and written into separate columns. Transactions will operate on disjoint column families and reduce the likelihood of conflicts.
- For workloads where large or transactions run concurrently over similar key ranges, watch for anchor hotspots (for example, many concurrent transactions with on the same ). In these cases, consider enabling the cluster setting to randomize the location of transaction anchor keys. This can spread transaction records across ranges and reduce hotspotting. Only use this setting after confirming anchor hotspots via contention and range-level observability.
-
As a last resort, consider adjusting the using the
kv.closed_timestamp.target_durationto reduce the likelihood of long-running write transactions having their . This setting should be carefully adjusted if no other mitigations are available because there can be downstream implications (e.g., historical reads, change data capture feeds, statistics collection, handling zone configurations, etc.). For example, a transaction A is forced to refresh (i.e., change its timestamp) due to hitting the maximum interval (closed timestamps enable and ). This can happen when transaction A is a long-running transaction, and there is a write by another transaction to data that A has already read.
If you increase the
kv.closed_timestamp.target_duration setting, it means that you are increasing the amount of time by which the data available in and lags behind the current state of the cluster. In other words, there is a trade-off here: if you absolutely must execute long-running transactions that execute concurrently with other transactions that are writing to the same data, you may have to settle for longer delays on Follower Reads and/or CDC to avoid frequent serialization errors. The anomaly that would be exhibited if these transactions were not retried is called write skew.Hotspots
Hotspots are a symptom of resource contention and can create problems as requests increase, including excessive transaction contention. For a detailed explanation of hotspot causes and mitigation strategies, refer to the and the pages.Indicators that your cluster has hotspots
- The CPU Percent graph on the and dashboards (DB Console) shows spikes in CPU usage.
- The Top Ranges list on the (DB Console) displays a higher-than-expected QPS for a range.
- The (DB Console) shows for the cluster.
Reduce hotspots
- Use index keys with a random distribution of values, so that transactions over different rows are more likely to operate on separate data ranges. See the on row IDs for suggestions.
-
Place parts of the records that are modified by different transactions in different tables. That is, increase normalization. However, there are benefits and drawbacks to increasing normalization.
-
Benefits of increasing normalization:
- Can improve performance for write-heavy workloads. This is because, with increased normalization, a given business fact must be written to one place rather than to multiple places.
- Allows separate transactions to modify related underlying data without causing .
- Reduces the chance of data inconsistency, since a given business fact must be written only to one place.
- Reduces or eliminates data redundancy.
- Uses less disk space.
-
Drawbacks of increasing normalization:
- Can reduce performance for read-heavy workloads. This is because increasing normalization results in more joins, and can make the SQL more complicated in other ways.
- More complex data model.
-
In general:
- Increase normalization for write-intensive and read/write-intensive transactional workloads.
- Do not increase normalization for read-intensive reporting workloads.
-
Benefits of increasing normalization:
- If the application strictly requires operating on very few different index keys, consider using so that each index key can be served by a separate group of nodes in the cluster.
- If you are working with a table that must be indexed on sequential keys, consider using . For details about the mechanics and performance improvements of hash-sharded indexes in CockroachDB, see the blog post Hash Sharded Indexes Unlock Linear Scaling for Sequential Workloads. As part of this, we recommend doing thorough performance testing with and without hash-sharded indexes to see which works best for your application.
-
To avoid read hotspots:
- Increase data distribution, which will allow for more ranges. The hotspot exists because the data being accessed is all co-located in one range.
-
Increase across more nodes in the same range. Most transactional reads must go to the leaseholder in CockroachDB, which means that opportunities for load balancing over replicas are minimal.
However, the following features do permit load balancing over replicas:
- .
- (both the bounded staleness and the exact staleness kinds).
Statements with full table scans
Full table scans often result in poor statement performance.Indicators that your application has statements with full table scans
-
The following query returns statements with full table scans in their statement plan:
-
The following query against the
crdb_internal.node_statement_statisticstable returns results: - Viewing the statement plan on the in the DB Console indicates that the plan contains full table scans.
- The statement plans returned by the and indicate that there are full table scans.
- The in the DB Console is showing spikes over time.
Fix full table scans in statements
Not every full table scan is an indicator of poor performance. The may decide on a full table scan when other or would result in longer execution time. that result in full table scans and consider adding . In the DB Console, visit the on the and check if there are any insights to create missing indexes. These missing index recommendations are generated based on . A missing index may cause a statement to have a . If the execution was slow, based on the insights threshold, then it’s likely the create index recommendation is valid. If the plan had a full table scan, it’s likely that it should be removed with an index. Also see .Suboptimal primary keys
Indicators that your tables are using suboptimal primary keys
- The in the DB Console shows high resource usage per node.
- The Problem Ranges report on the in the DB Console indicates a high number of queries per second on a subset of ranges or nodes.
Fix suboptimal primary keys
Evaluate the schema of your table to see if you can redistribute data more evenly across multiple ranges. Specifically, make sure you have followed . If your application with a small dataset (for example, a dataset that contains few index key values) is experiencing resource contention, consider splitting your tables and indexes to to reduce resource contention.Slow writes
Indicators that your tables are experiencing slow writes
If the in the DB Console shows high service latency when the QPS ofINSERT and UPDATE statements is high, your tables are experiencing slow writes.
Fix slow writes
can improve application read performance. However, there is overhead in maintaining secondary indexes that can affect your write performance. You should profile your tables periodically to determine whether an index is worth the overhead. To identify infrequently accessed indexes that could be candidates to drop, do one of the following:- In the DB Console, visit the on the and check if there are any insights to drop unused indexes.
- In the DB Console, visit the and check databases and tables for to drop unused indexes.
-
Run a join query against the and
crdb_internal.table_indexestables:Use the values in thetotal_readsandlast_readcolumns to identify indexes that have low usage or are stale and can be dropped.
Too many MVCC values
Indicators that your tables have too many MVCC values
In the DB Console, the of the for a given database shows the percentage of live data for each table. For example: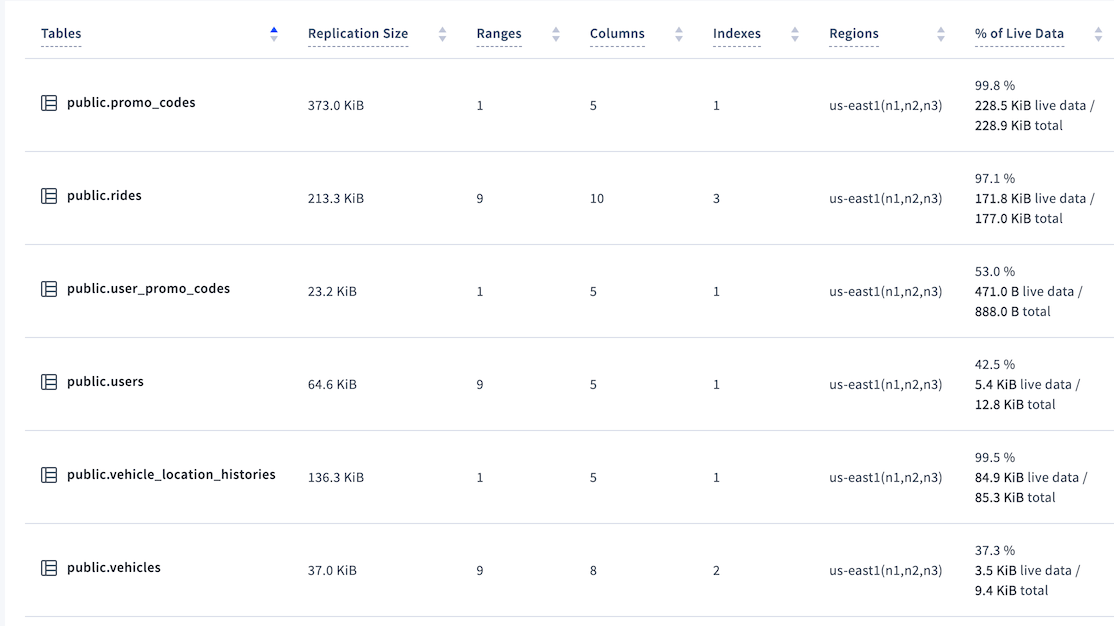
37.3% the vehicles table would be considered to have a low percentage of live data. In the worst cases, the percentage can be 0%.
A low percentage of live data can cause statements to scan more data () than required, which can reduce performance.
Configure CockroachDB to purge MVCC values
Reduce the zone configuration of the table as much as possible.KV DistSender batches being throttled (performance impact to larger clusters)
If you seedistsender.batches.async.throttled values that aren’t zero (or aren’t consistently near zero), experiment with increasing the and Streamer concurrency using the kv.dist_sender.concurrency_limit and kv.streamer.concurrency_limit , respectively. In v24.3, these default values were increased by 6x and 12x, respectively. For versions prior to v24.3, increasing the values by 6x and 12x would be a good starting point.
To validate a successful result, you can increase the values of these cluster settings until you see no new throttled requests and no increase in tail latency (e.g., p99.999).
This does increase the amount of RAM consumption per node to handle the increased concurrency, but it’s proportional to the load and an individual flow’s memory consumption should not be significant. Bad outcomes include increased tail latency or too much memory consumption with no decrease in the number of throttled requests, in which case you should return the settings to their default values.